Logo ROOT  
Reference Guide
 
Loading...
Searching...
No Matches
rf607_fitresult.py File Reference

Detailed Description

View in nbviewer Open in SWAN
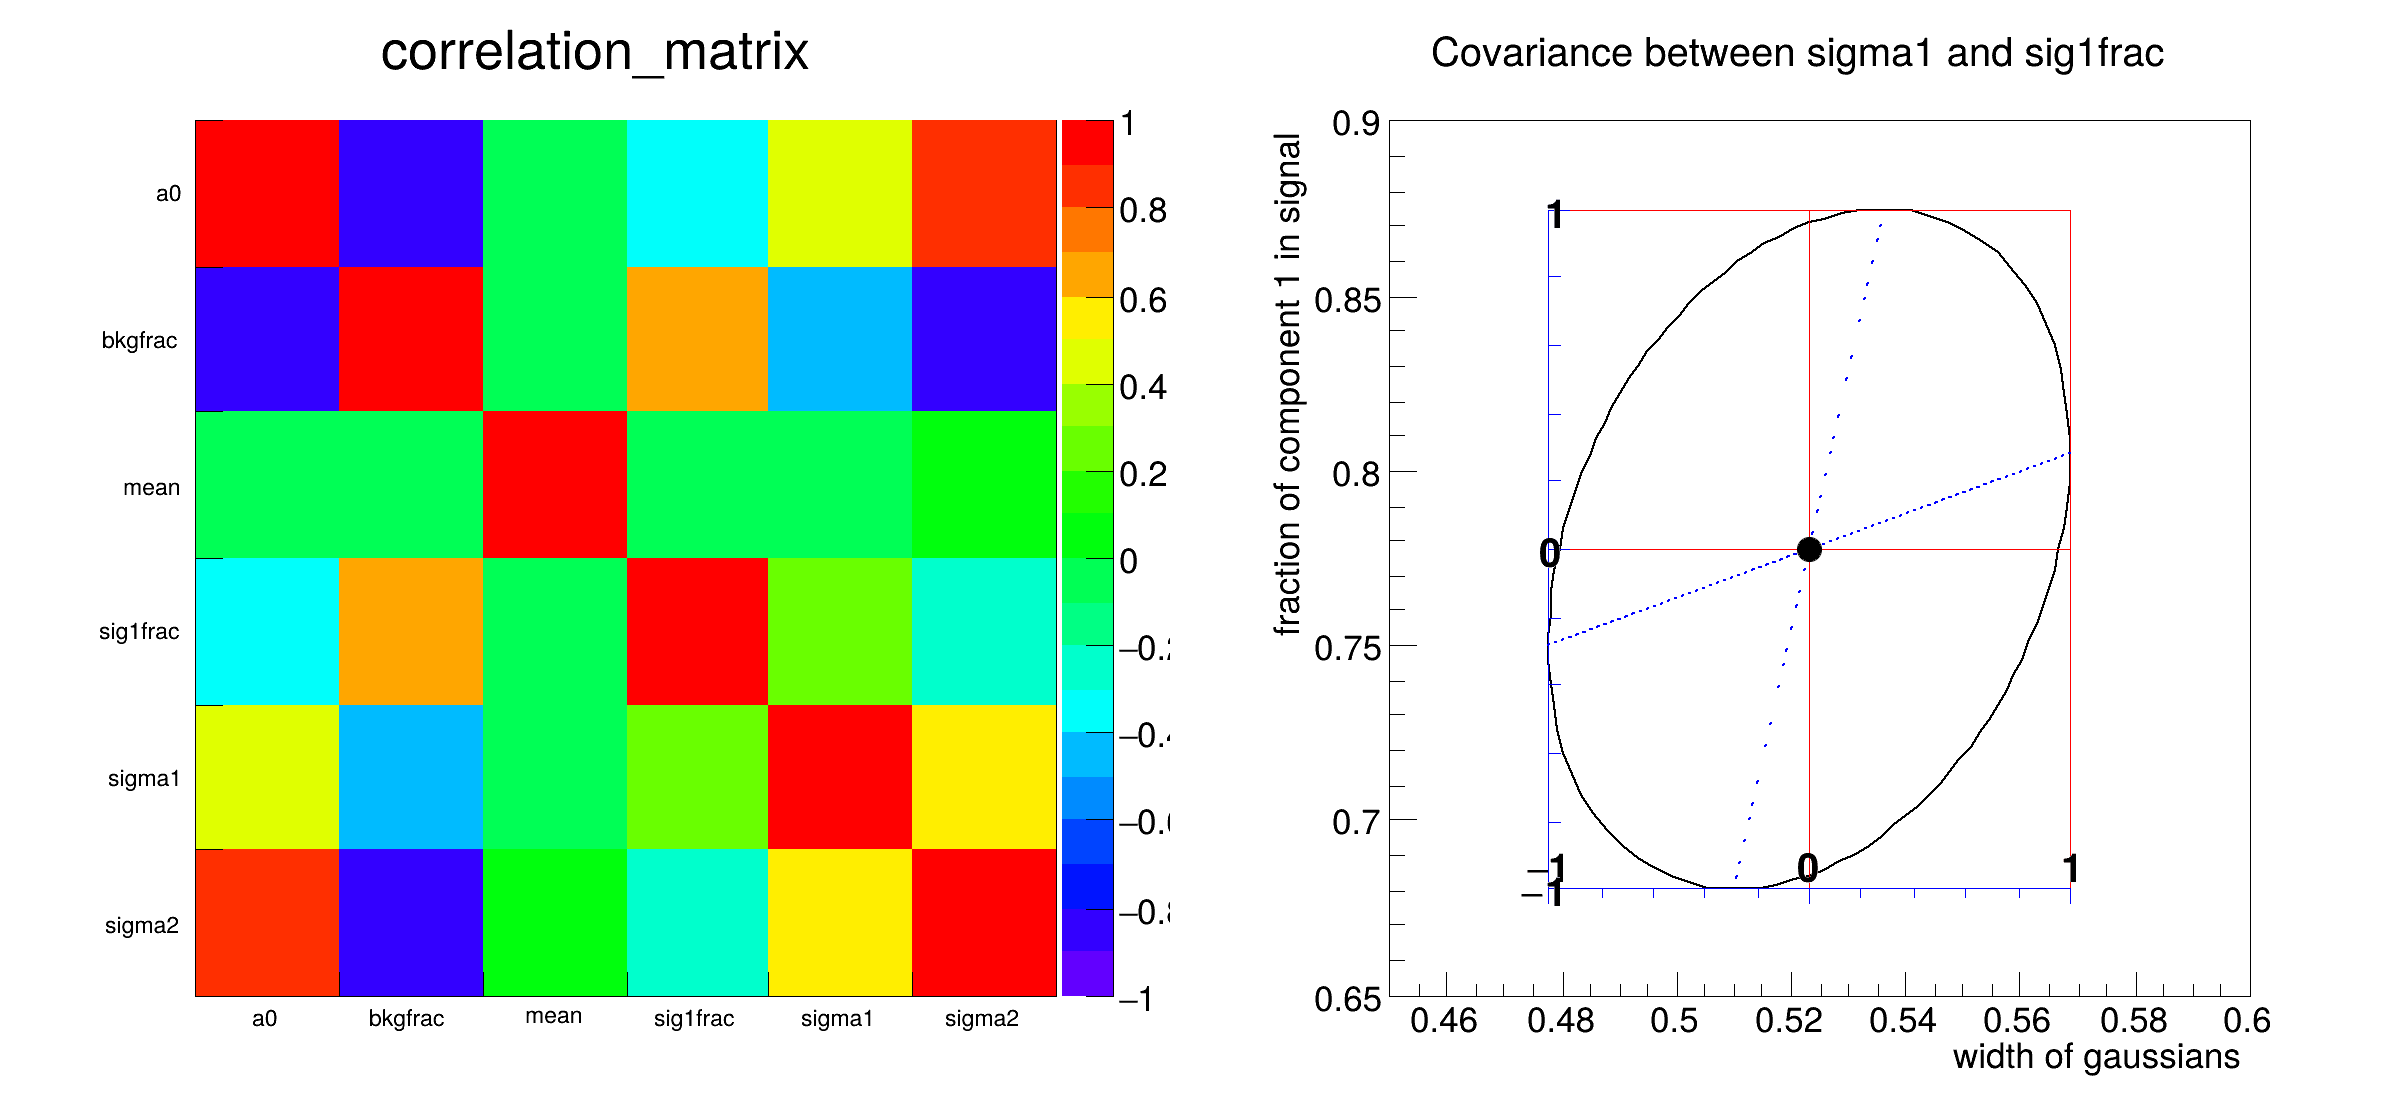
Likelihood and minimization: demonstration of options of the RooFitResult class

from __future__ import print_function
import ROOT
# Create pdf, data
# --------------------------------
# Declare observable x
x = ROOT.RooRealVar("x", "x", 0, 10)
# Create two Gaussian PDFs g1(x,mean1,sigma) anf g2(x,mean2,sigma) and
# their parameters
mean = ROOT.RooRealVar("mean", "mean of gaussians", 5, -10, 10)
sigma1 = ROOT.RooRealVar("sigma1", "width of gaussians", 0.5, 0.1, 10)
sigma2 = ROOT.RooRealVar("sigma2", "width of gaussians", 1, 0.1, 10)
sig1 = ROOT.RooGaussian("sig1", "Signal component 1", x, mean, sigma1)
sig2 = ROOT.RooGaussian("sig2", "Signal component 2", x, mean, sigma2)
# Build Chebychev polynomial pdf
a0 = ROOT.RooRealVar("a0", "a0", 0.5, 0.0, 1.0)
a1 = ROOT.RooRealVar("a1", "a1", -0.2)
bkg = ROOT.RooChebychev("bkg", "Background", x, [a0, a1])
# Sum the signal components into a composite signal pdf
sig1frac = ROOT.RooRealVar("sig1frac", "fraction of component 1 in signal", 0.8, 0.0, 1.0)
sig = ROOT.RooAddPdf("sig", "Signal", [sig1, sig2], [sig1frac])
# Sum the composite signal and background
bkgfrac = ROOT.RooRealVar("bkgfrac", "fraction of background", 0.5, 0.0, 1.0)
model = ROOT.RooAddPdf("model", "g1+g2+a", [bkg, sig], [bkgfrac])
# Generate 1000 events
data = model.generate({x}, 1000)
# Fit pdf to data, save fit result
# -------------------------------------------------------------
# Perform fit and save result
r = model.fitTo(data, Save=True, PrintLevel=-1)
# Print fit results
# ---------------------------------
# Summary printing: Basic info plus final values of floating fit parameters
r.Print()
# Verbose printing: Basic info, of constant parameters, and
# final values of floating parameters, correlations
r.Print("v")
# Visualize correlation matrix
# -------------------------------------------------------
# Construct 2D color plot of correlation matrix
ROOT.gStyle.SetOptStat(0)
ROOT.gStyle.SetPalette(1)
hcorr = r.correlationHist()
# Visualize ellipse corresponding to single correlation matrix element
frame = ROOT.RooPlot(sigma1, sig1frac, 0.45, 0.60, 0.65, 0.90)
frame.SetTitle("Covariance between sigma1 and sig1frac")
r.plotOn(frame, sigma1, sig1frac, "ME12ABHV")
# Access fit result information
# ---------------------------------------------------------
# Access basic information
print("EDM = ", r.edm())
print("-log(L) minimum = ", r.minNll())
# Access list of final fit parameter values
print("final value of floating parameters")
r.floatParsFinal().Print("s")
# Access correlation matrix elements
print("correlation between sig1frac and a0 is ", r.correlation(sig1frac, a0))
print("correlation between bkgfrac and mean is ", r.correlation("bkgfrac", "mean"))
# Extract covariance and correlation matrix as ROOT.TMatrixDSym
cor = r.correlationMatrix()
cov = r.covarianceMatrix()
# Print correlation, matrix
print("correlation matrix")
cor.Print()
print("covariance matrix")
cov.Print()
# Persist fit result in root file
# -------------------------------------------------------------
# Open ROOT file save save result
f = ROOT.TFile("rf607_fitresult.root", "RECREATE")
r.Write("rf607")
f.Close()
# In a clean ROOT session retrieve the persisted fit result as follows:
# r = gDirectory.Get("rf607")
c = ROOT.TCanvas("rf607_fitresult", "rf607_fitresult", 800, 400)
c.Divide(2)
c.cd(1)
ROOT.gPad.SetLeftMargin(0.15)
hcorr.GetYaxis().SetTitleOffset(1.4)
hcorr.Draw("colz")
c.cd(2)
ROOT.gPad.SetLeftMargin(0.15)
frame.GetYaxis().SetTitleOffset(1.6)
frame.Draw()
c.SaveAs("rf607_fitresult.png")
void Print(GNN_Data &d, std::string txt="")
[#1] INFO:Fitting -- RooAbsPdf::fitTo(model) fixing normalization set for coefficient determination to observables in data
[#1] INFO:Fitting -- using CPU computation library compiled with -mavx2
[#1] INFO:Fitting -- RooAddition::defaultErrorLevel(nll_model_modelData) Summation contains a RooNLLVar, using its error level
[#1] INFO:Minimization -- RooAbsMinimizerFcn::setOptimizeConst: activating const optimization
[#1] INFO:Minimization -- RooAbsMinimizerFcn::setOptimizeConst: deactivating const optimization
RooFitResult: minimized FCN value: 1885.34, estimated distance to minimum: 0.000381082
covariance matrix quality: Full, accurate covariance matrix
Status : MINIMIZE=0 HESSE=0
Floating Parameter FinalValue +/- Error
-------------------- --------------------------
a0 7.2873e-01 +/- 1.13e-01
bkgfrac 4.3445e-01 +/- 8.57e-02
mean 5.0345e+00 +/- 3.36e-02
sig1frac 7.7758e-01 +/- 9.71e-02
sigma1 5.2318e-01 +/- 4.55e-02
sigma2 1.7671e+00 +/- 1.18e+00
RooFitResult: minimized FCN value: 1885.34, estimated distance to minimum: 0.000381082
covariance matrix quality: Full, accurate covariance matrix
Status : MINIMIZE=0 HESSE=0
Constant Parameter Value
-------------------- ------------
a1 -2.0000e-01
Floating Parameter InitialValue FinalValue +/- Error GblCorr.
-------------------- ------------ -------------------------- --------
a0 5.0000e-01 7.2873e-01 +/- 1.13e-01 <none>
bkgfrac 5.0000e-01 4.3445e-01 +/- 8.57e-02 <none>
mean 5.0000e+00 5.0345e+00 +/- 3.36e-02 <none>
sig1frac 8.0000e-01 7.7758e-01 +/- 9.71e-02 <none>
sigma1 5.0000e-01 5.2318e-01 +/- 4.55e-02 <none>
sigma2 1.0000e+00 1.7671e+00 +/- 1.18e+00 <none>
1) RooRealVar:: a0 = 0.72873 +/- 0.112573
2) RooRealVar:: bkgfrac = 0.43445 +/- 0.085744
3) RooRealVar:: mean = 5.03451 +/- 0.0336279
4) RooRealVar:: sig1frac = 0.777578 +/- 0.0971233
5) RooRealVar:: sigma1 = 0.523178 +/- 0.0455077
6) RooRealVar:: sigma2 = 1.76714 +/- 1.18159
6x6 matrix is as follows
| 0 | 1 | 2 | 3 | 4 |
----------------------------------------------------------------------
0 | 1 -0.8038 -0.02304 -0.3837 0.4249
1 | -0.8038 1 -0.05161 0.6011 -0.4042
2 | -0.02304 -0.05161 1 -0.08752 -0.04055
3 | -0.3837 0.6011 -0.08752 1 0.2836
4 | 0.4249 -0.4042 -0.04055 0.2836 1
5 | 0.8347 -0.8794 0.0146 -0.2731 0.5878
| 5 |
----------------------------------------------------------------------
0 | 0.8347
1 | -0.8794
2 | 0.0146
3 | -0.2731
4 | 0.5878
5 | 1
6x6 matrix is as follows
| 0 | 1 | 2 | 3 | 4 |
----------------------------------------------------------------------
0 | 0.01295 -0.007884 -8.818e-05 -0.004281 0.002201
1 | -0.007884 0.007427 -0.0001496 0.005078 -0.001585
2 | -8.818e-05 -0.0001496 0.001131 -0.0002885 -6.206e-05
3 | -0.004281 0.005078 -0.0002885 0.00961 0.001265
4 | 0.002201 -0.001585 -6.206e-05 0.001265 0.002071
5 | 0.1142 -0.09113 0.0005905 -0.0322 0.03217
| 5 |
----------------------------------------------------------------------
0 | 0.1142
1 | -0.09113
2 | 0.0005905
3 | -0.0322
4 | 0.03217
5 | 1.446
EDM = 0.0003810824372158841
-log(L) minimum = 1885.344093393465
final value of floating parameters
correlation between sig1frac and a0 is -0.3837127139109296
correlation between bkgfrac and mean is -0.05161247508597615
correlation matrix
covariance matrix
Date
February 2018
Authors
Clemens Lange, Wouter Verkerke (C++ version)

Definition in file rf607_fitresult.py.