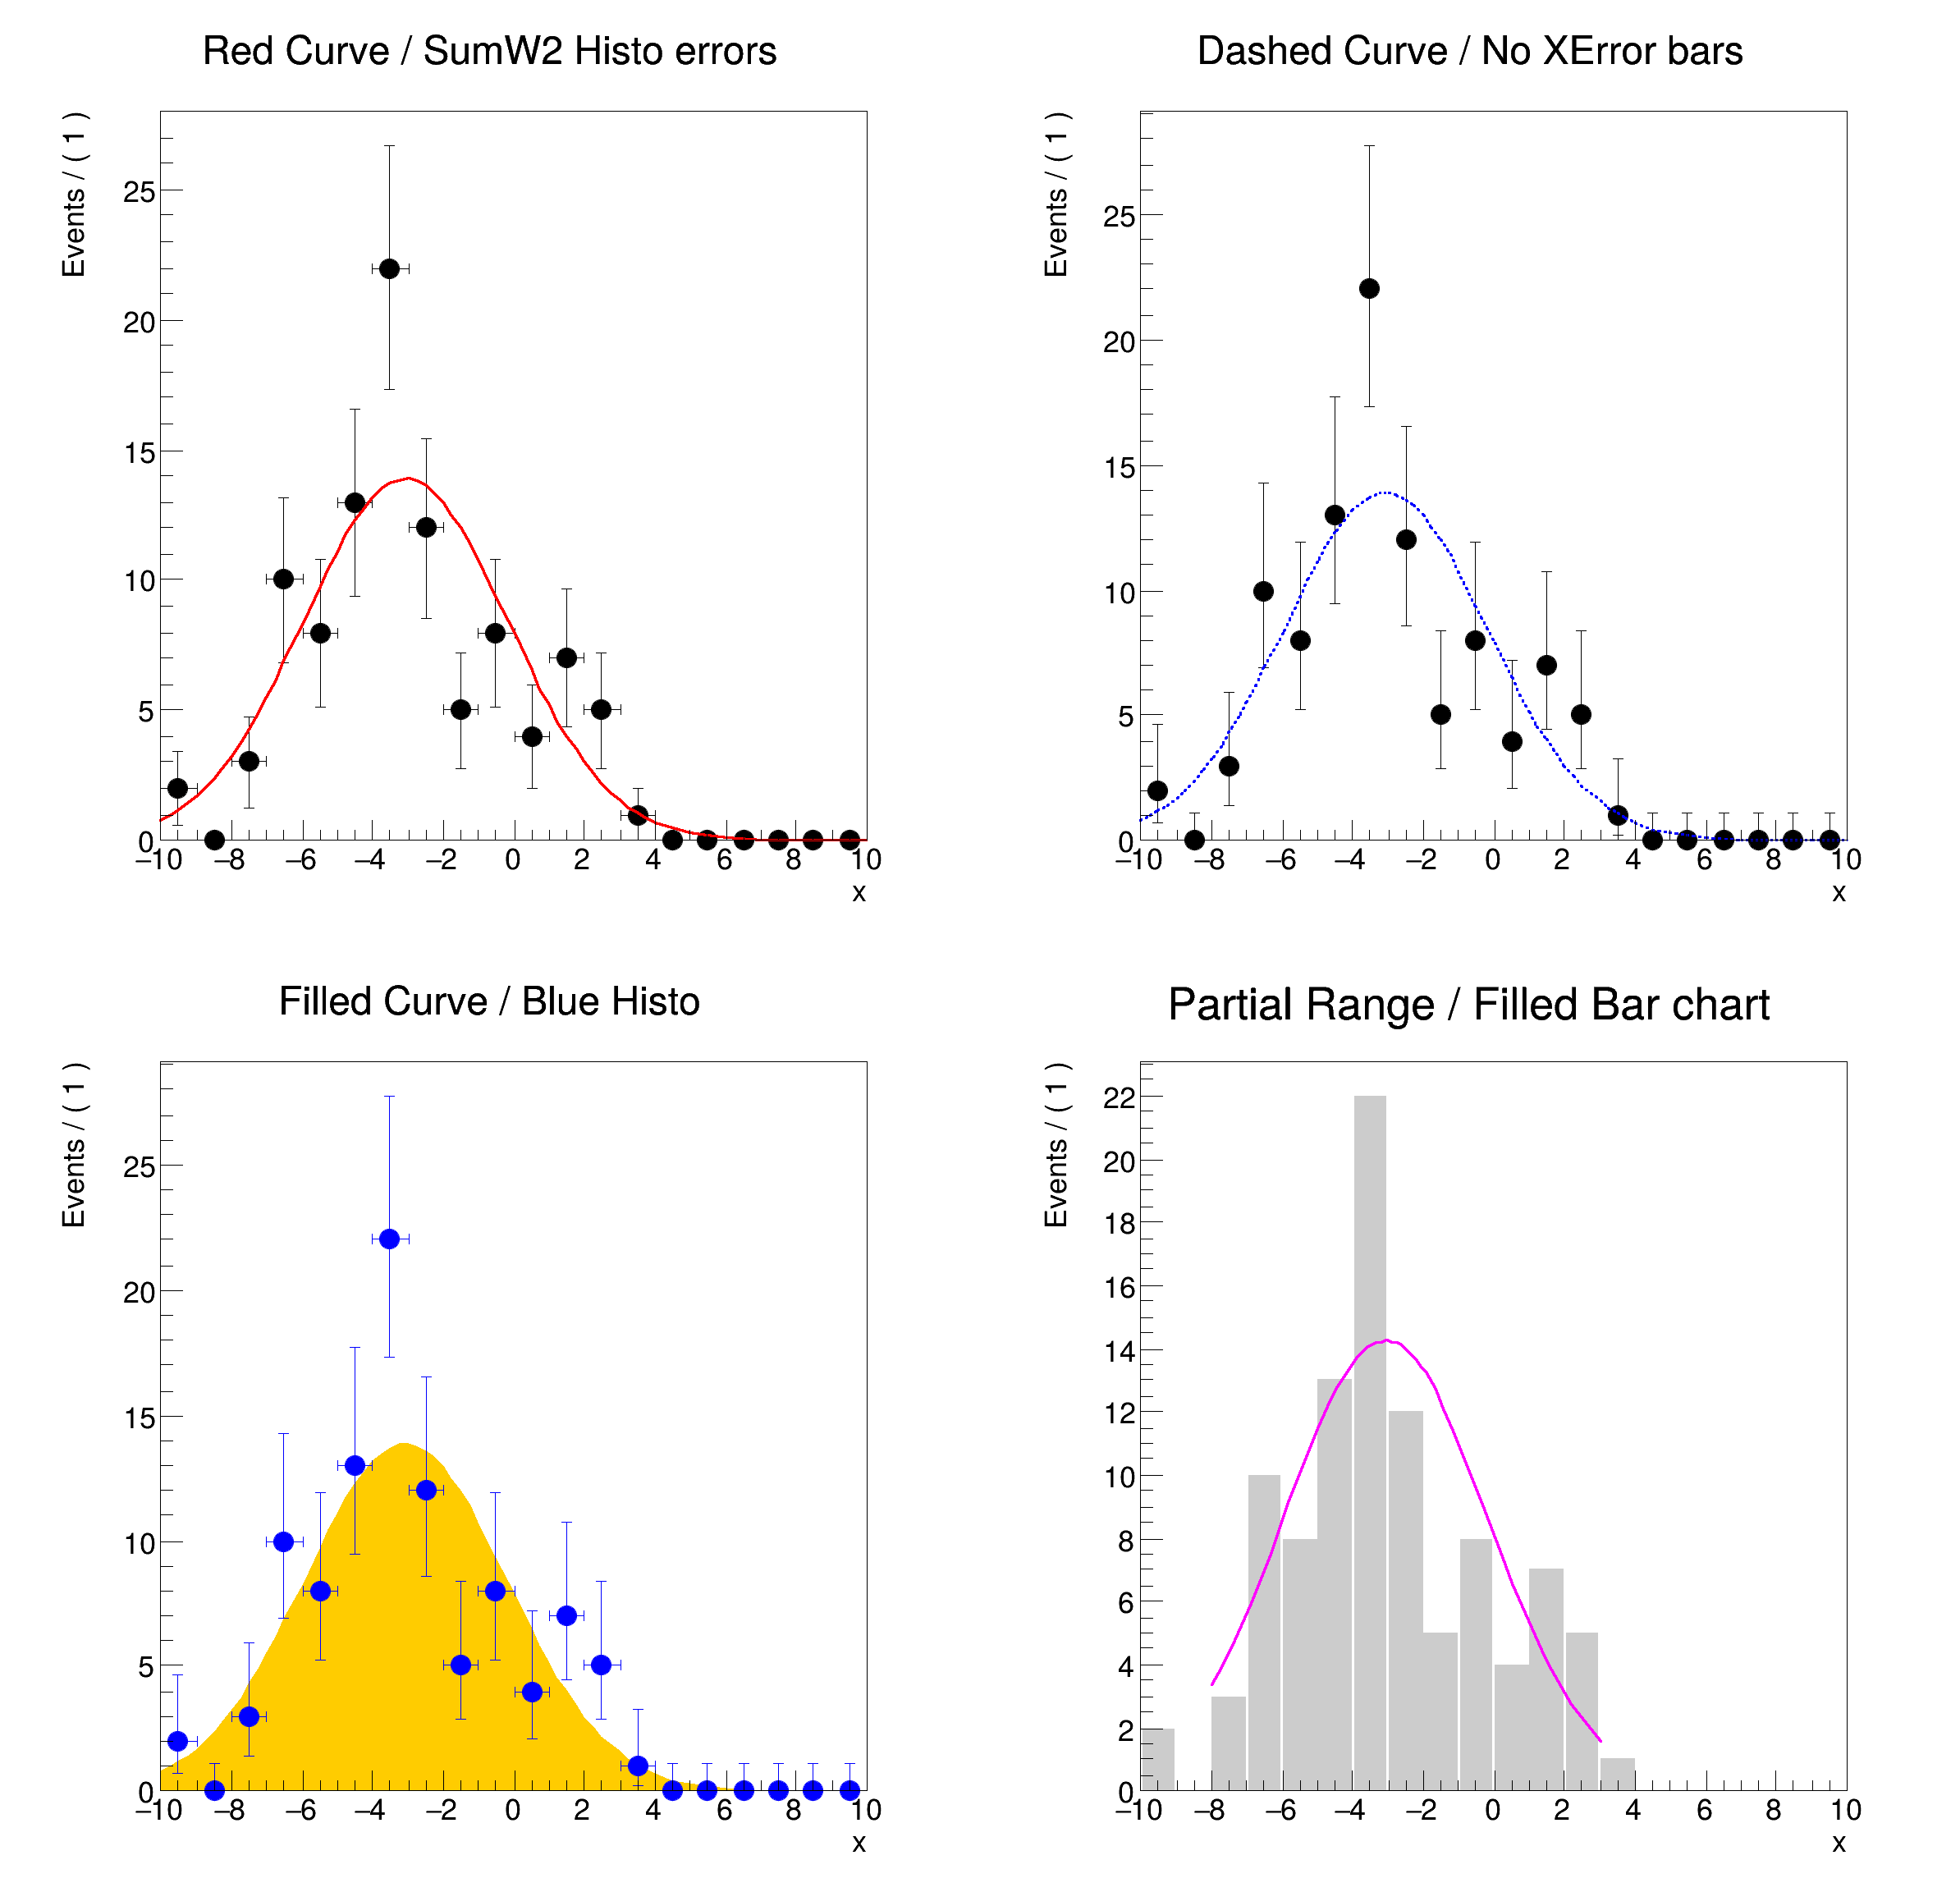

Basic functionality: various plotting styles of data, functions in a RooPlot

{
std::unique_ptr<RooDataSet>
data{gauss.generate(
x, 100)};
gauss.fitTo(*
data, PrintLevel(-1));
RooPlot *
frame1 =
x.frame(Name(
"xframe"), Title(
"Red Curve / SumW2 Histo errors"), Bins(20));
RooPlot *
frame2 =
x.frame(Name(
"xframe"), Title(
"Dashed Curve / No XError bars"), Bins(20));
RooPlot *
frame3 =
x.frame(Name(
"xframe"), Title(
"Filled Curve / Blue Histo"), Bins(20));
RooPlot *
frame4 =
x.frame(Name(
"xframe"), Title(
"Partial Range / Filled Bar chart"), Bins(20));
gauss.plotOn(
frame3, DrawOption(
"F"), FillColor(
kOrange), MoveToBack());
TCanvas *
c =
new TCanvas(
"rf107_plotstyles",
"rf107_plotstyles", 800, 800);
gPad->SetLeftMargin(0.15);
frame1->GetYaxis()->SetTitleOffset(1.6);
gPad->SetLeftMargin(0.15);
frame2->GetYaxis()->SetTitleOffset(1.6);
gPad->SetLeftMargin(0.15);
frame3->GetYaxis()->SetTitleOffset(1.6);
gPad->SetLeftMargin(0.15);
frame4->GetYaxis()->SetTitleOffset(1.6);
}
Option_t Option_t TPoint TPoint const char GetTextMagnitude GetFillStyle GetLineColor GetLineWidth GetMarkerStyle GetTextAlign GetTextColor GetTextSize void data
Plot frame and a container for graphics objects within that frame.
Variable that can be changed from the outside.
The namespace RooFit contains mostly switches that change the behaviour of functions of PDFs (or othe...
[#1] INFO:Fitting -- RooAbsPdf::fitTo(gauss_over_gauss_Int[x]) fixing normalization set for coefficient determination to observables in data
[#1] INFO:Fitting -- using CPU computation library compiled with -mavx512
[#1] INFO:Fitting -- RooAddition::defaultErrorLevel(nll_gauss_over_gauss_Int[x]_gaussData) Summation contains a RooNLLVar, using its error level
[#1] INFO:Minimization -- RooAbsMinimizerFcn::setOptimizeConst: activating const optimization
[#1] INFO:Minimization -- RooAbsMinimizerFcn::setOptimizeConst: deactivating const optimization
[#1] INFO:Plotting -- RooAbsPdf::plotOn(gauss) only plotting range [-8,3], curve is normalized to data in given range
[#1] INFO:Eval -- RooRealVar::setRange(x) new range named 'plotRange' created with bounds [-8,3]
- Date
- July 2008
- Author
- Wouter Verkerke
Definition in file rf107_plotstyles.C.


