import ROOT
dt = ROOT.RooRealVar("dt", "dt", -20, 20)
mixState = ROOT.RooCategory("mixState", "B0/B0bar mixing state", {"mixed": -1, "unmixed": 1})
tagFlav = ROOT.RooCategory("tagFlav", "Flavour of the tagged B0", {"B0": 1, "B0bar": -1})
dm = ROOT.RooRealVar("dm", "delta m(B)", 0.472, 0.0, 1.0)
tau = ROOT.RooRealVar("tau", "B0 decay time", 1.547, 1.0, 2.0)
w = ROOT.RooRealVar("w", "Flavor Mistag rate", 0.03, 0.0, 1.0)
dw = ROOT.RooRealVar("dw", "Flavor Mistag rate difference between B0 and B0bar", 0.01)
bias1 = ROOT.RooRealVar("bias1", "bias1", 0)
sigma1 = ROOT.RooRealVar("sigma1", "sigma1", 0.01)
gm1 = ROOT.RooGaussModel("gm1", "gauss model 1", dt, bias1, sigma1)
bmix_gm1 = ROOT.RooBMixDecay("bmix", "decay", dt, mixState, tagFlav, tau, dm, w, dw, gm1, type="DoubleSided")
data = bmix_gm1.generate({dt, tagFlav, mixState}, 20000)
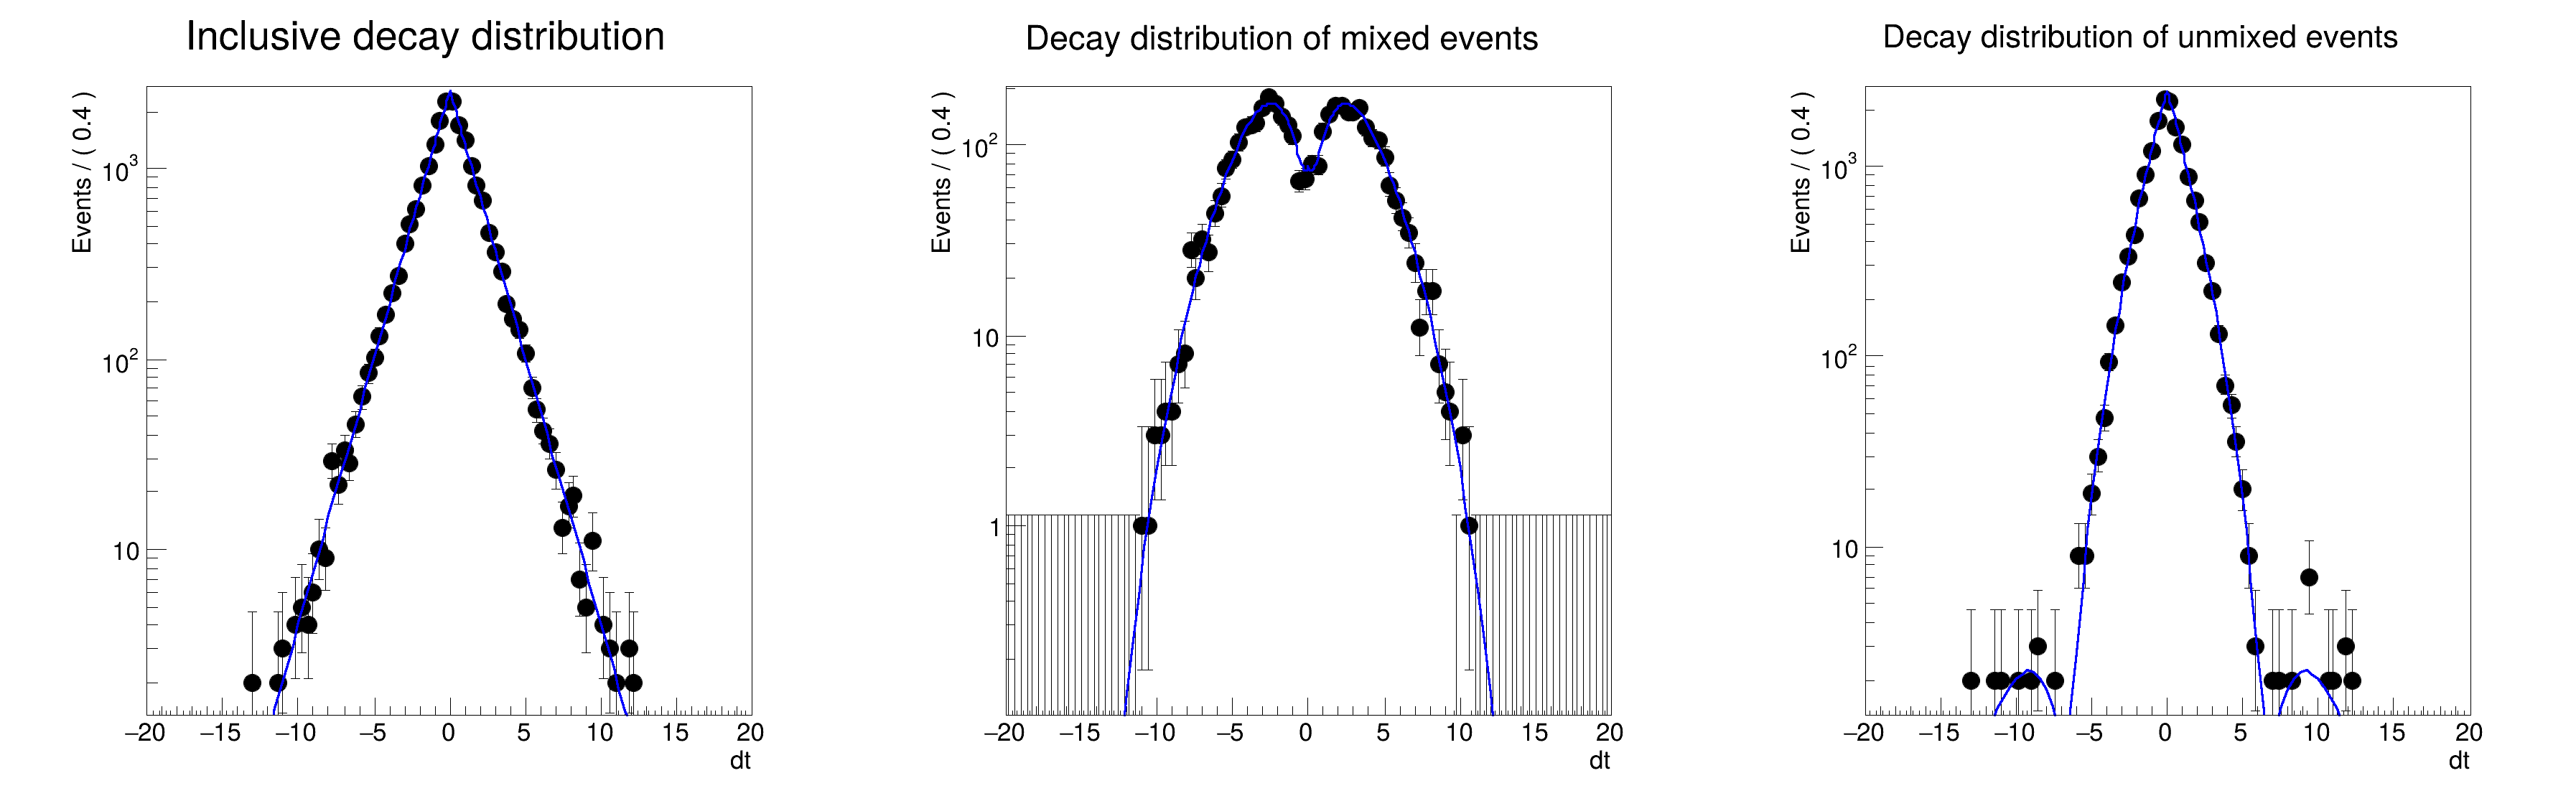
frame = dt.frame(Title="Inclusive decay distribution")
data.plotOn(frame)
bmix_gm1.plotOn(frame)
frame2 = dt.frame(Title="Decay distribution of mixed events")
data.plotOn(frame2, Cut="mixState==mixState::mixed")
bmix_gm1.plotOn(frame2, Slice=(mixState, "mixed"))
frame3 = dt.frame(Title="Decay distribution of unmixed events")
data.plotOn(frame3, Cut="mixState==mixState::unmixed")
bmix_gm1.plotOn(frame3, Slice=(mixState, "unmixed"))
c = ROOT.TCanvas("rf310_sliceplot", "rf310_sliceplot", 1200, 400)
c.Divide(3)
c.cd(1)
ROOT.gPad.SetLeftMargin(0.15)
frame.GetYaxis().SetTitleOffset(1.4)
ROOT.gPad.SetLogy()
frame.Draw()
c.cd(2)
ROOT.gPad.SetLeftMargin(0.15)
frame2.GetYaxis().SetTitleOffset(1.4)
ROOT.gPad.SetLogy()
frame2.Draw()
c.cd(3)
ROOT.gPad.SetLeftMargin(0.15)
frame3.GetYaxis().SetTitleOffset(1.4)
ROOT.gPad.SetLogy()
frame3.Draw()
c.SaveAs("rf310_sliceplot.png")
[#1] INFO:Plotting -- RooAbsReal::plotOn(bmix) plot on dt integrates over variables (mixState,tagFlav)
[#1] INFO:Plotting -- RooTreeData::plotOn: plotting 3787 events out of 20000 total events
[#1] INFO:Plotting -- RooAbsReal::plotOn(bmix) plot on dt represents a slice in (mixState)
[#1] INFO:Plotting -- RooAbsReal::plotOn(bmix) plot on dt integrates over variables (tagFlav)
[#1] INFO:Plotting -- RooTreeData::plotOn: plotting 16213 events out of 20000 total events
[#1] INFO:Plotting -- RooAbsReal::plotOn(bmix) plot on dt represents a slice in (mixState)
[#1] INFO:Plotting -- RooAbsReal::plotOn(bmix) plot on dt integrates over variables (tagFlav)