import ROOT
x = ROOT.RooRealVar("x", "x", -8, 8)
mean = ROOT.RooRealVar("mean", "mean", 0, -8, 8)
sigma = ROOT.RooRealVar("sigma", "sigma", 0.3, 0.1, 10)
gx = ROOT.RooGaussian("gx", "gx", x, mean, sigma)
a0 = ROOT.RooRealVar("a0", "a0", -0.1, -1, 1)
a1 = ROOT.RooRealVar("a1", "a1", 0.004, -1, 1)
px = ROOT.RooChebychev("px", "px", x, [a0, a1])
f = ROOT.RooRealVar("f", "f", 0.2, 0.0, 1.0)
model = ROOT.RooAddPdf("model", "model", [gx, px], [f])
mean_ctl = ROOT.RooRealVar("mean_ctl", "mean_ctl", -3, -8, 8)
gx_ctl = ROOT.RooGaussian("gx_ctl", "gx_ctl", x, mean_ctl, sigma)
a0_ctl = ROOT.RooRealVar("a0_ctl", "a0_ctl", -0.1, -1, 1)
a1_ctl = ROOT.RooRealVar("a1_ctl", "a1_ctl", 0.5, -0.1, 1)
px_ctl = ROOT.RooChebychev("px_ctl", "px_ctl", x, [a0_ctl, a1_ctl])
f_ctl = ROOT.RooRealVar("f_ctl", "f_ctl", 0.5, 0.0, 1.0)
model_ctl = ROOT.RooAddPdf("model_ctl", "model_ctl", [gx_ctl, px_ctl], [f_ctl])
data = model.generate({x}, 1000)
data_ctl = model_ctl.generate({x}, 2000)
sample = ROOT.RooCategory("sample", "sample")
sample.defineType("physics")
sample.defineType("control")
combData = ROOT.RooDataSet(
"combData",
"combined data",
{x},
Index=sample,
Import={"physics": data, "control": data_ctl},
)
simPdf = ROOT.RooSimultaneous("simPdf", "simultaneous pdf", {"physics": model, "control": model_ctl}, sample)
fitResult = simPdf.fitTo(combData, PrintLevel=-1, Save=True)
fitResult.Print()
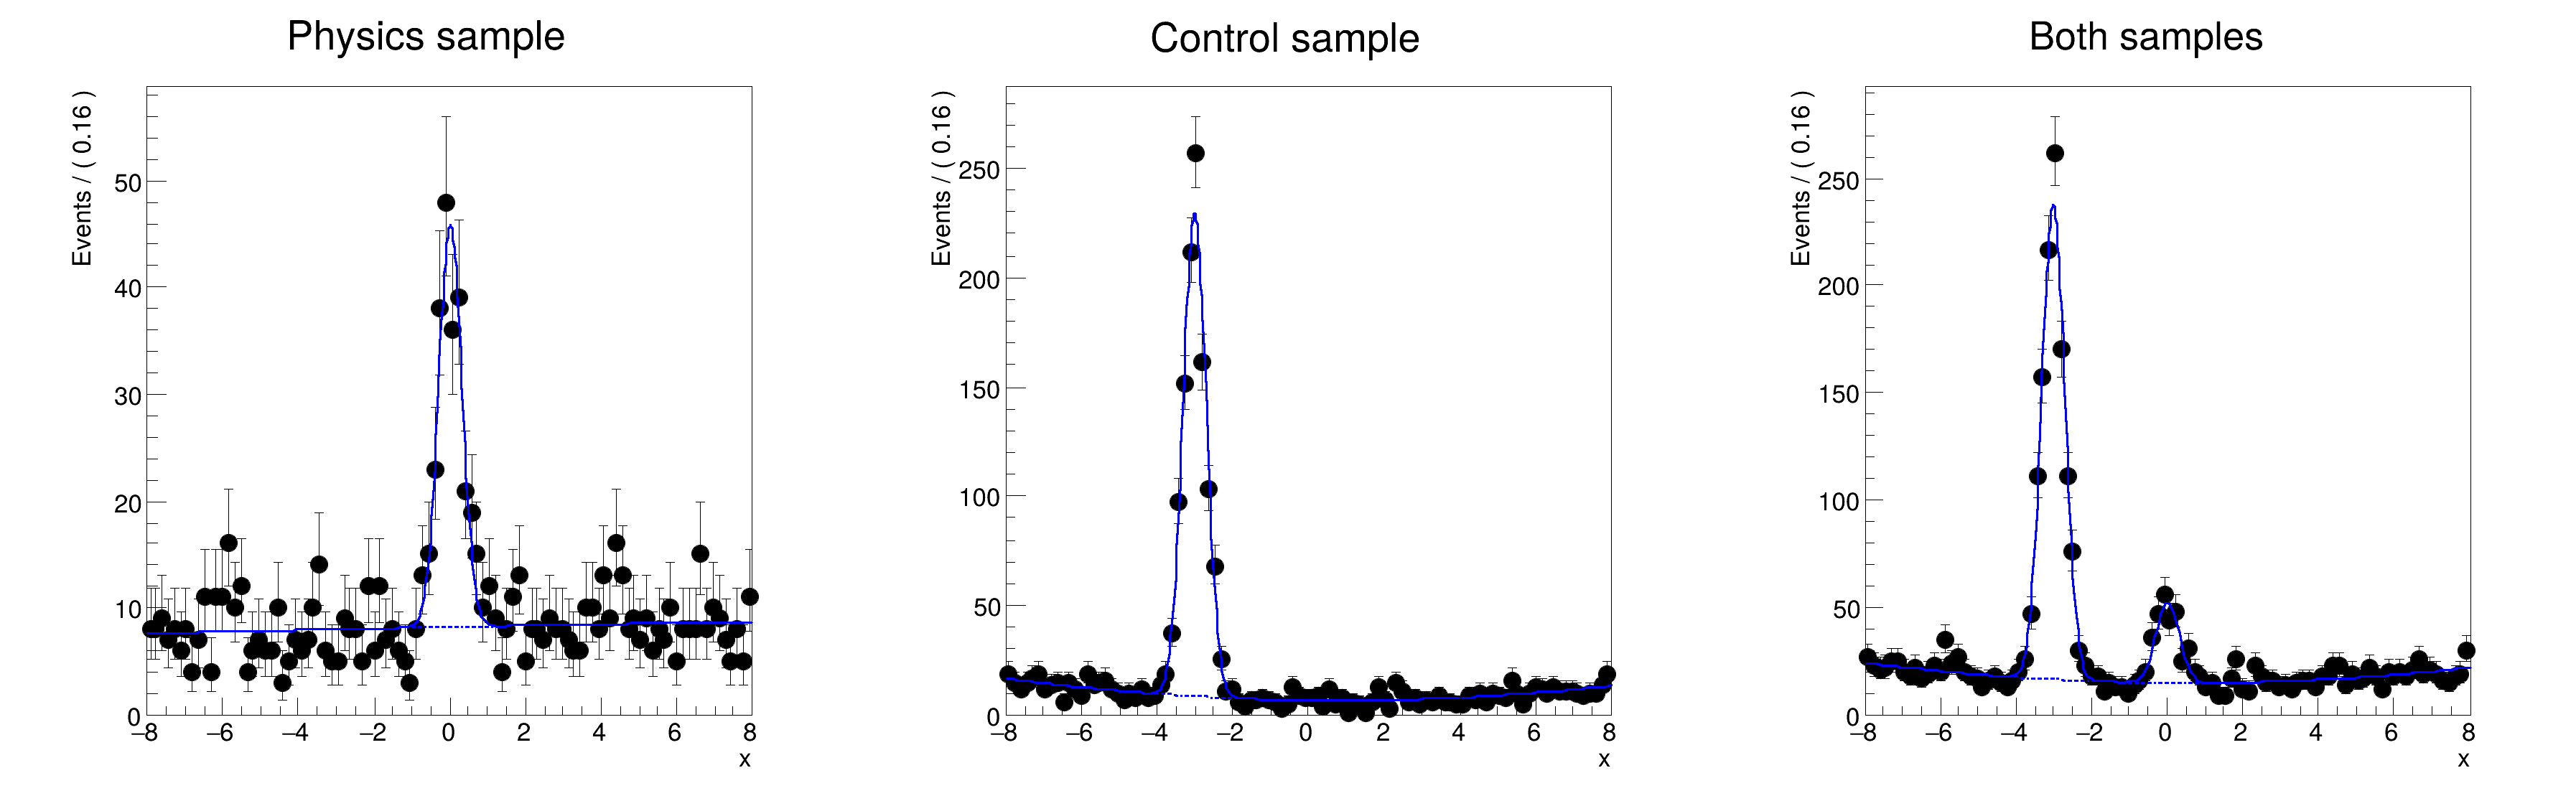
frame1 = x.frame(Title="Physics sample")
combData.plotOn(frame1, Cut="sample==sample::physics")
simPdf.plotOn(frame1, Slice=(sample, "physics"), ProjWData=(sample, combData))
simPdf.plotOn(frame1, Slice=(sample, "physics"), Components="px", ProjWData=(sample, combData), LineStyle="--")
frame2 = x.frame(Title="Control sample")
slicedData = combData.reduce(Cut="sample==sample::control")
slicedData.plotOn(frame2)
simPdf.plotOn(frame2, ProjWData=(sample, slicedData))
simPdf.plotOn(frame2, Components="px_ctl", ProjWData=(sample, slicedData), LineStyle="--")
frame3 = x.frame(Title="Both samples")
combData.plotOn(frame3)
simPdf.plotOn(frame3, ProjWData=(sample, combData))
simPdf.plotOn(frame3, Components="px,px_ctl", ProjWData=(sample, combData), LineStyle="--")
c = ROOT.TCanvas("rf501_simultaneouspdf", "rf501_simultaneouspdf", 1200, 400)
c.Divide(3)
def draw(i, frame):
c.cd(i)
ROOT.gPad.SetLeftMargin(0.15)
frame.GetYaxis().SetTitleOffset(1.4)
frame.Draw()
draw(1, frame1)
draw(2, frame2)
draw(3, frame3)
c.SaveAs("rf501_simultaneouspdf.png")
[#1] INFO:Fitting -- RooAbsPdf::fitTo(simPdf) fixing normalization set for coefficient determination to observables in data
[#1] INFO:Fitting -- using CPU computation library compiled with -mavx512
[#1] INFO:Fitting -- RooAddition::defaultErrorLevel(nll_simPdf_combData) Summation contains a RooNLLVar, using its error level
[#1] INFO:Minimization -- RooAbsMinimizerFcn::setOptimizeConst: activating const optimization
[#1] INFO:Minimization -- RooAbsMinimizerFcn::setOptimizeConst: deactivating const optimization
RooFitResult: minimized FCN value: 8630.62, estimated distance to minimum: 0.000174671
covariance matrix quality: Full, accurate covariance matrix
Status : MINIMIZE=0 HESSE=0
Floating Parameter FinalValue +/- Error
-------------------- --------------------------
a0 6.7634e-02 +/- 6.04e-02
a0_ctl -1.5627e-01 +/- 5.53e-02
a1 -3.8353e-03 +/- 6.32e-02
a1_ctl 3.8442e-01 +/- 4.35e-02
f 1.7952e-01 +/- 1.55e-02
f_ctl 5.2710e-01 +/- 1.25e-02
mean 1.4991e-02 +/- 3.34e-02
mean_ctl -3.0079e+00 +/- 1.04e-02
sigma 3.0450e-01 +/- 8.33e-03
[#1] INFO:Plotting -- RooTreeData::plotOn: plotting 1000 events out of 3000 total events
[#1] INFO:Plotting -- RooSimultaneous::plotOn(simPdf) plot on x represents a slice in the index category (sample)
[#1] INFO:Plotting -- RooAbsReal::plotOn(model) slice variable sample was not projected anyway
[#1] INFO:Plotting -- RooSimultaneous::plotOn(simPdf) plot on x represents a slice in the index category (sample)
[#1] INFO:Plotting -- RooAbsPdf::plotOn(model) directly selected PDF components: (px)
[#1] INFO:Plotting -- RooAbsPdf::plotOn(model) indirectly selected PDF components: ()
[#1] INFO:Plotting -- RooAbsReal::plotOn(model) slice variable sample was not projected anyway
[#1] INFO:Plotting -- RooSimultaneous::plotOn(simPdf) plot on x averages with data index category (sample)
[#1] INFO:Plotting -- RooSimultaneous::plotOn(simPdf) plot on x averages with data index category (sample)
[#1] INFO:Plotting -- RooAbsPdf::plotOn(simPdf) directly selected PDF components: (px_ctl)
[#1] INFO:Plotting -- RooAbsPdf::plotOn(simPdf) indirectly selected PDF components: (model_ctl)
[#1] INFO:Plotting -- RooSimultaneous::plotOn(simPdf) plot on x averages with data index category (sample)
[#1] INFO:Plotting -- RooSimultaneous::plotOn(simPdf) plot on x averages with data index category (sample)
[#1] INFO:Plotting -- RooAbsPdf::plotOn(simPdf) directly selected PDF components: (px,px_ctl)
[#1] INFO:Plotting -- RooAbsPdf::plotOn(simPdf) indirectly selected PDF components: (model_ctl,model)