import ROOT
x = ROOT.RooRealVar("x", "x", -10, 10)
m = ROOT.RooRealVar("m", "m", 0, -10, 10)
s = ROOT.RooRealVar("s", "s", 2, 1, 50)
sig = ROOT.RooGaussian("sig", "sig", x, m, s)
m2 = ROOT.RooRealVar("m2", "m2", -1, -10, 10)
s2 = ROOT.RooRealVar("s2", "s2", 6, 1, 50)
bkg = ROOT.RooGaussian("bkg", "bkg", x, m2, s2)
fsig = ROOT.RooRealVar("fsig", "fsig", 0.33, 0, 1)
model = ROOT.RooAddPdf("model", "model", [sig, bkg], [fsig])
x.setBins(25)
d = model.generateBinned({x}, 1000)
r = model.fitTo(d, Save=True, PrintLevel=-1)
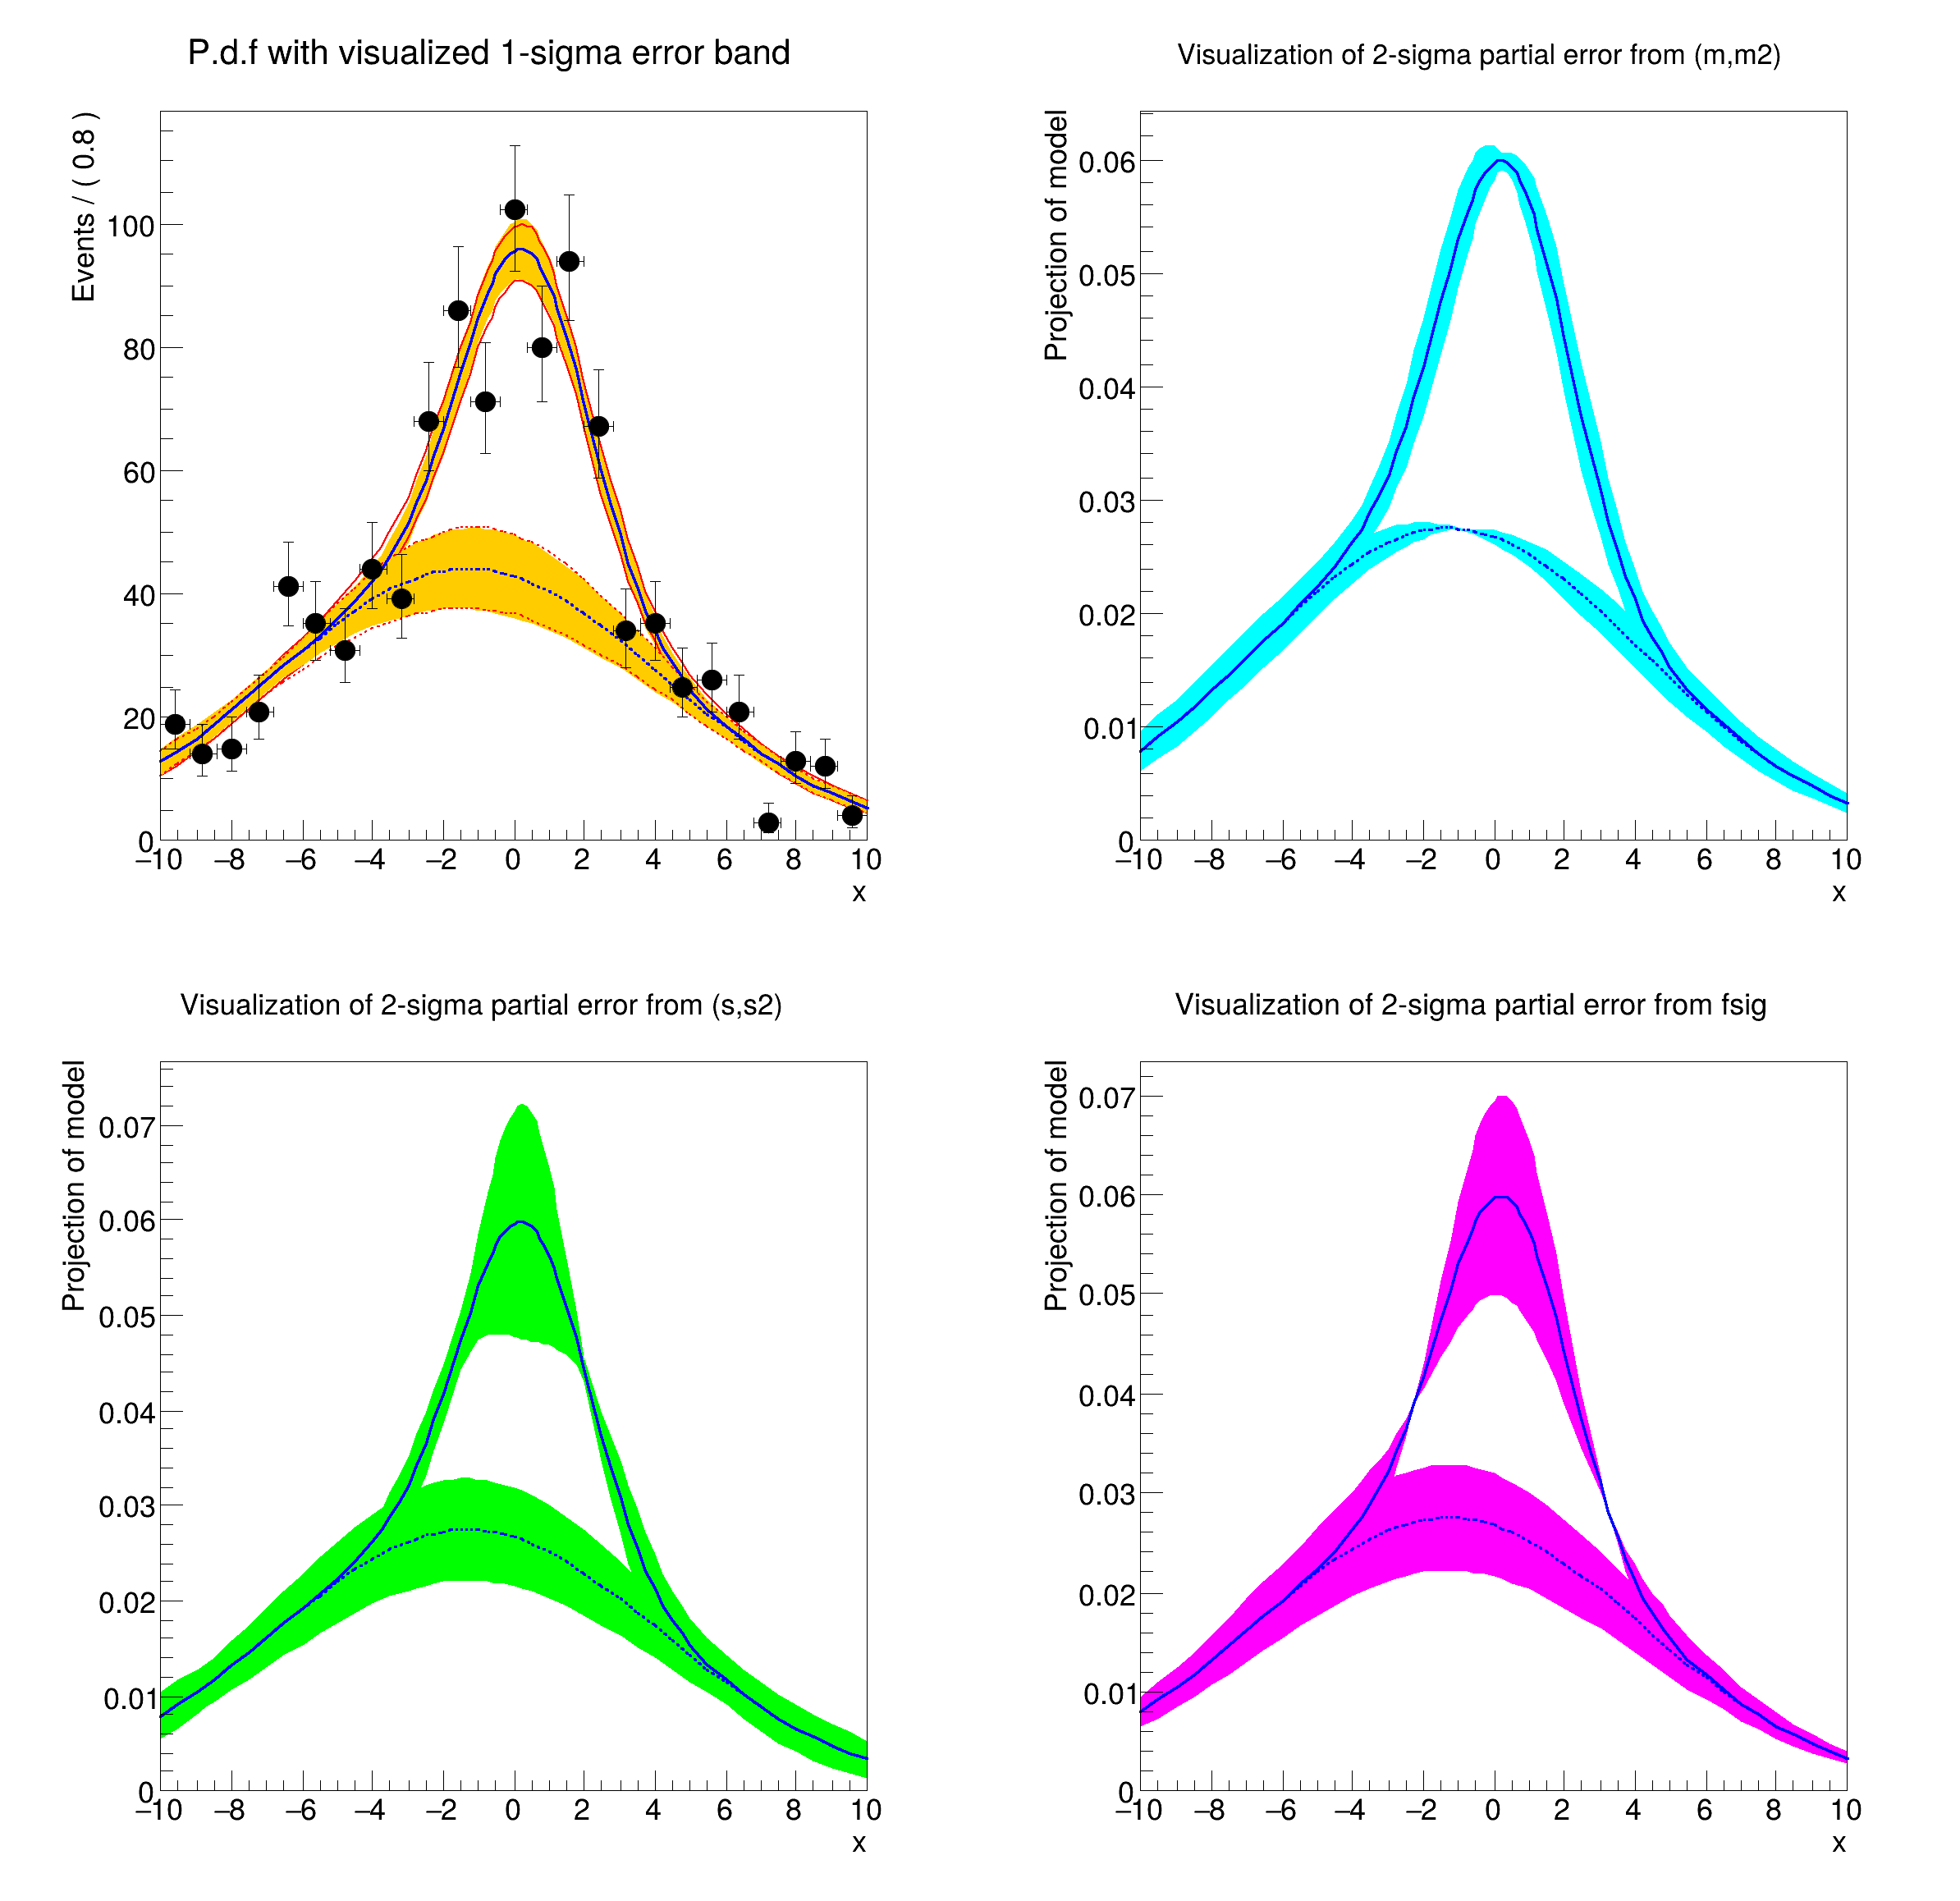
frame = x.frame(Bins=40, Title="P.d.f with visualized 1-sigma error band")
d.plotOn(frame)
model.plotOn(frame, VisualizeError=(r, 1), FillColor="kOrange")
model.plotOn(frame, VisualizeError=(r, 1, False), DrawOption="L", LineWidth=2, LineColor="r")
model.plotOn(frame, VisualizeError=(r, 1), FillColor="kOrange", Components="bkg")
model.plotOn(
frame,
VisualizeError=(r, 1, False),
DrawOption="L",
LineWidth=2,
LineColor="r",
Components="bkg",
LineStyle="--",
)
model.plotOn(frame)
model.plotOn(frame, Components="bkg", LineStyle="--")
d.plotOn(frame)
frame.SetMinimum(0)
frame2 = x.frame(Bins=40, Title="Visualization of 2-sigma partial error from (m,m2)")
model.plotOn(frame2, VisualizeError=(r, {m, m2}, 2), FillColor="c")
model.plotOn(frame2, Components="bkg", VisualizeError=(r, {m, m2}, 2), FillColor="c")
model.plotOn(frame2)
model.plotOn(frame2, Components="bkg", LineStyle="--")
frame2.SetMinimum(0)
frame3 = x.frame(Bins=40, Title="Visualization of 2-sigma partial error from (s,s2)")
model.plotOn(frame3, VisualizeError=(r, {s, s2}, 2), FillColor="g")
model.plotOn(frame3, Components="bkg", VisualizeError=(r, {fsig}, 2), FillColor="g")
model.plotOn(frame3)
model.plotOn(frame3, Components="bkg", LineStyle="--")
frame3.SetMinimum(0)
frame4 = x.frame(Bins=40, Title="Visualization of 2-sigma partial error from fsig")
model.plotOn(frame4, VisualizeError=(r, {fsig}, 2), FillColor="m")
model.plotOn(frame4, Components="bkg", VisualizeError=(r, {fsig}, 2), FillColor="m")
model.plotOn(frame4)
model.plotOn(frame4, Components="bkg", LineStyle="--")
frame4.SetMinimum(0)
c = ROOT.TCanvas("rf610_visualerror", "rf610_visualerror", 800, 800)
c.Divide(2, 2)
c.cd(1)
ROOT.gPad.SetLeftMargin(0.15)
frame.GetYaxis().SetTitleOffset(1.4)
frame.Draw()
c.cd(2)
ROOT.gPad.SetLeftMargin(0.15)
frame2.GetYaxis().SetTitleOffset(1.6)
frame2.Draw()
c.cd(3)
ROOT.gPad.SetLeftMargin(0.15)
frame3.GetYaxis().SetTitleOffset(1.6)
frame3.Draw()
c.cd(4)
ROOT.gPad.SetLeftMargin(0.15)
frame4.GetYaxis().SetTitleOffset(1.6)
frame4.Draw()
c.SaveAs("rf610_visualerror.png")
[#1] INFO:Fitting -- RooAbsPdf::fitTo(model) fixing normalization set for coefficient determination to observables in data
[#1] INFO:Fitting -- using CPU computation library compiled with -mavx512
[#1] INFO:Fitting -- RooAddition::defaultErrorLevel(nll_model_genData) Summation contains a RooNLLVar, using its error level
[#1] INFO:Minimization -- RooAbsMinimizerFcn::setOptimizeConst: activating const optimization
[#1] INFO:Minimization -- RooAbsMinimizerFcn::setOptimizeConst: deactivating const optimization
[#1] INFO:Plotting -- RooAbsReal::plotOn(model) INFO: visualizing 1-sigma uncertainties in parameters (m,s,fsig,m2,s2) from fit result fitresult_model_genData using 315 samplings.
[#1] INFO:Plotting -- RooAbsPdf::plotOn(model) directly selected PDF components: (bkg)
[#1] INFO:Plotting -- RooAbsPdf::plotOn(model) indirectly selected PDF components: ()
[#1] INFO:Plotting -- RooAbsPdf::plotOn(model) directly selected PDF components: (bkg)
[#1] INFO:Plotting -- RooAbsPdf::plotOn(model) indirectly selected PDF components: ()
[#1] INFO:Plotting -- RooAbsPdf::plotOn(model) directly selected PDF components: (bkg)
[#1] INFO:Plotting -- RooAbsPdf::plotOn(model) indirectly selected PDF components: ()
[#1] INFO:Plotting -- RooAbsPdf::plotOn(model) directly selected PDF components: (bkg)
[#1] INFO:Plotting -- RooAbsPdf::plotOn(model) indirectly selected PDF components: ()
[#1] INFO:Plotting -- RooAbsPdf::plotOn(model) directly selected PDF components: (bkg)
[#1] INFO:Plotting -- RooAbsPdf::plotOn(model) indirectly selected PDF components: ()
[#1] INFO:Plotting -- RooAbsPdf::plotOn(model) directly selected PDF components: (bkg)
[#1] INFO:Plotting -- RooAbsPdf::plotOn(model) indirectly selected PDF components: ()
[#1] INFO:Plotting -- RooAbsPdf::plotOn(model) directly selected PDF components: (bkg)
[#1] INFO:Plotting -- RooAbsPdf::plotOn(model) indirectly selected PDF components: ()