This tutorial shows the ingredients needed to setup the connection to a Dask cluster (e.g. a LocalCluster for a single machine). After this initial setup, an RDataFrame with distributed capabilities is created and connected to a Dask Client instance. Finally, a couple of histograms are drawn from the created columns in the dataset. Relevant documentation can be found at http://distributed.dask.org/en/stable .
import ROOT
"""
Setup connection to a Dask cluster. Two ingredients are needed:
1. Creating a cluster object that represents computing resources. This can be
done in various ways depending on the type of resources at disposal. To use
only the local machine (e.g. your laptop), a `LocalCluster` object can be
used. This step can be skipped if you have access to an existing Dask
cluster; in that case, the cluster administrator should provide you with a
URL to connect to the cluster in step 2. More options for cluster creation
can be found in the Dask docs at
http://distributed.dask.org/en/stable/api.html#cluster .
2. Creating a Dask client object that connects to the cluster. This accepts
directly the object previously created. In case the cluster was setup
externally, you need to provide an endpoint URL to the client, e.g.
'https://myscheduler.domain:8786'.
Through Dask, you can connect to various types of cluster resources. For
example, you can connect together a set of machines through SSH and use them
to run your computations. This is done through the `SSHCluster` class. For
example:
```python
from dask.distributed import SSHCluster
cluster = SSHCluster(
# A list with machine host names, the first name will be used as
# scheduler, following names will become workers.
hosts=["machine1","machine2","machine3"],
# A dictionary of options for each worker node, here we set the number
# of cores to be used on each node.
worker_options={"nprocs":4,},
)
```
Another common usecase is interfacing Dask to a batch system like HTCondor or
Slurm. A separate package called dask-jobqueue (https://jobqueue.dask.org)
extends the available Dask cluster classes to enable running Dask computations
as batch jobs. In this case, the cluster object usually receives the parameters
that would be written in the job description file. For example:
```python
from dask_jobqueue import HTCondorCluster
cluster = HTCondorCluster(
cores=1,
memory='2000MB',
disk='1000MB',
)
# Use the scale method to send as many jobs as needed
cluster.scale(4)
```
In this tutorial, a cluster object is created for the local machine, using
multiprocessing (processes=True) on 2 workers (n_workers=2) each using only
1 core (threads_per_worker=1) and 2GiB of RAM (memory_limit="2GiB").
"""
cluster =
LocalCluster(n_workers=2, threads_per_worker=1, processes=
True, memory_limit=
"2GiB")
client = Client(cluster)
return client
if __name__ == "__main__":
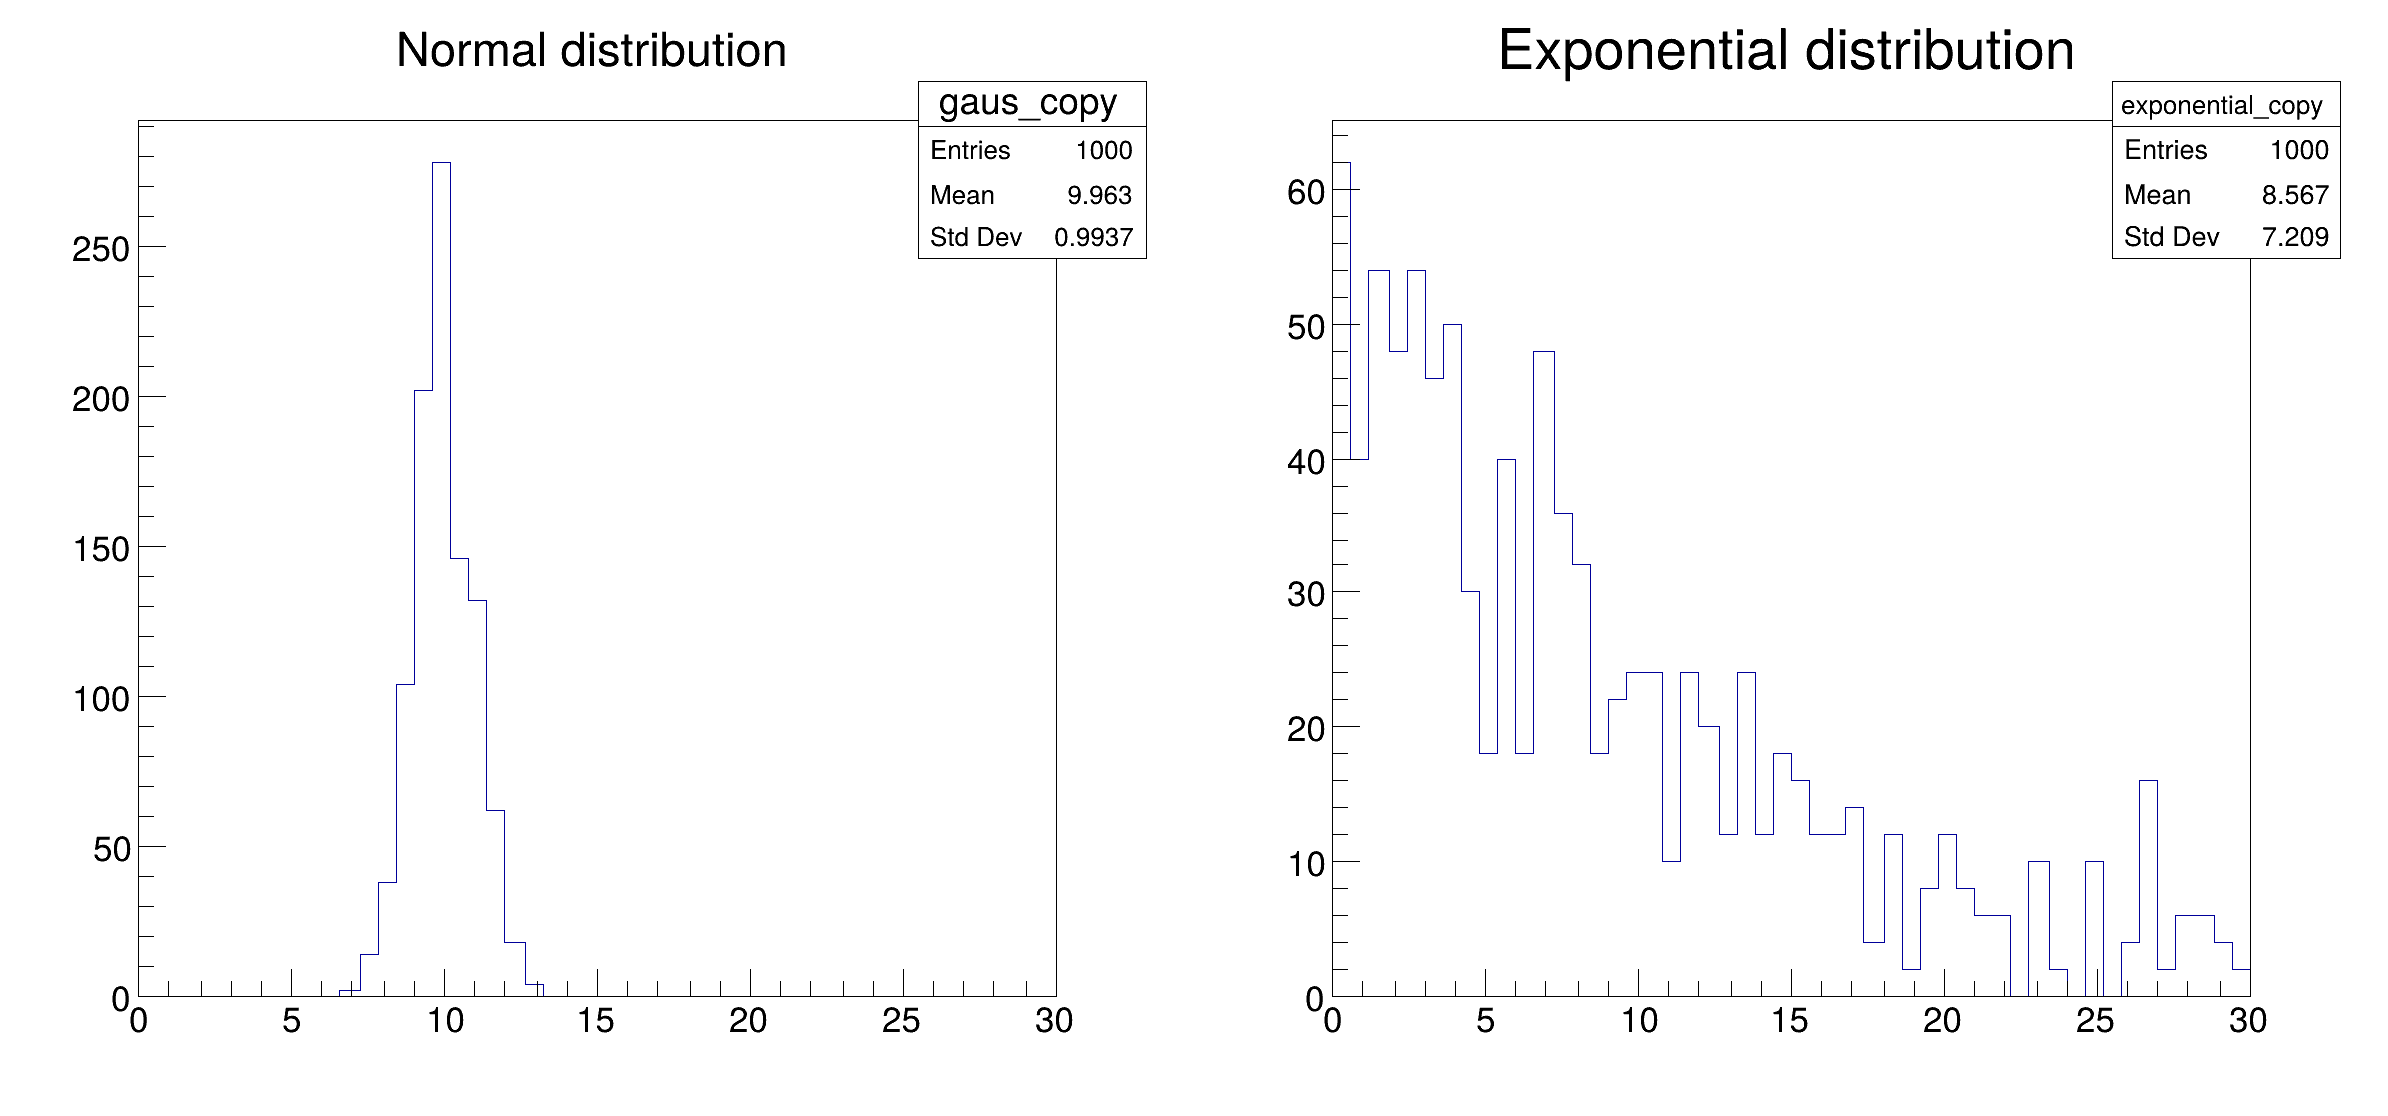
df_1 =
df.Define(
"gaus",
"gRandom->Gaus(10, 1)").Define(
"exponential",
"gRandom->Exp(10)")
h_gaus =
df_1.Histo1D((
"gaus",
"Normal distribution", 50, 0, 30),
"gaus")
h_exp =
df_1.Histo1D((
"exponential",
"Exponential distribution", 50, 0, 30),
"exponential")
c.SaveAs(
"distrdf002_dask_connection.png")
print("Saved figure to distrdf002_dask_connection.png")
ROOT::Detail::TRangeCast< T, true > TRangeDynCast
TRangeDynCast is an adapter class that allows the typed iteration through a TCollection.
ROOT's RDataFrame offers a modern, high-level interface for analysis of data stored in TTree ,...