This tutorial illustrates how to use TProfiles in combination with the RDataFrame. See the documentation of TProfile and TProfile2D to better understand the analogy of this code with the example one.
import ROOT
def fill_tree(treeName, fileName):
d.Define("px", "gRandom->Gaus()")\
.
Define(
"py",
"gRandom->Gaus()")\
.
Define(
"pz",
"sqrt(px * px + py * py)")\
.Snapshot(treeName, fileName)
fileName = "df003_profiles_py.root"
treeName = "myTree"
fill_tree(treeName, fileName)
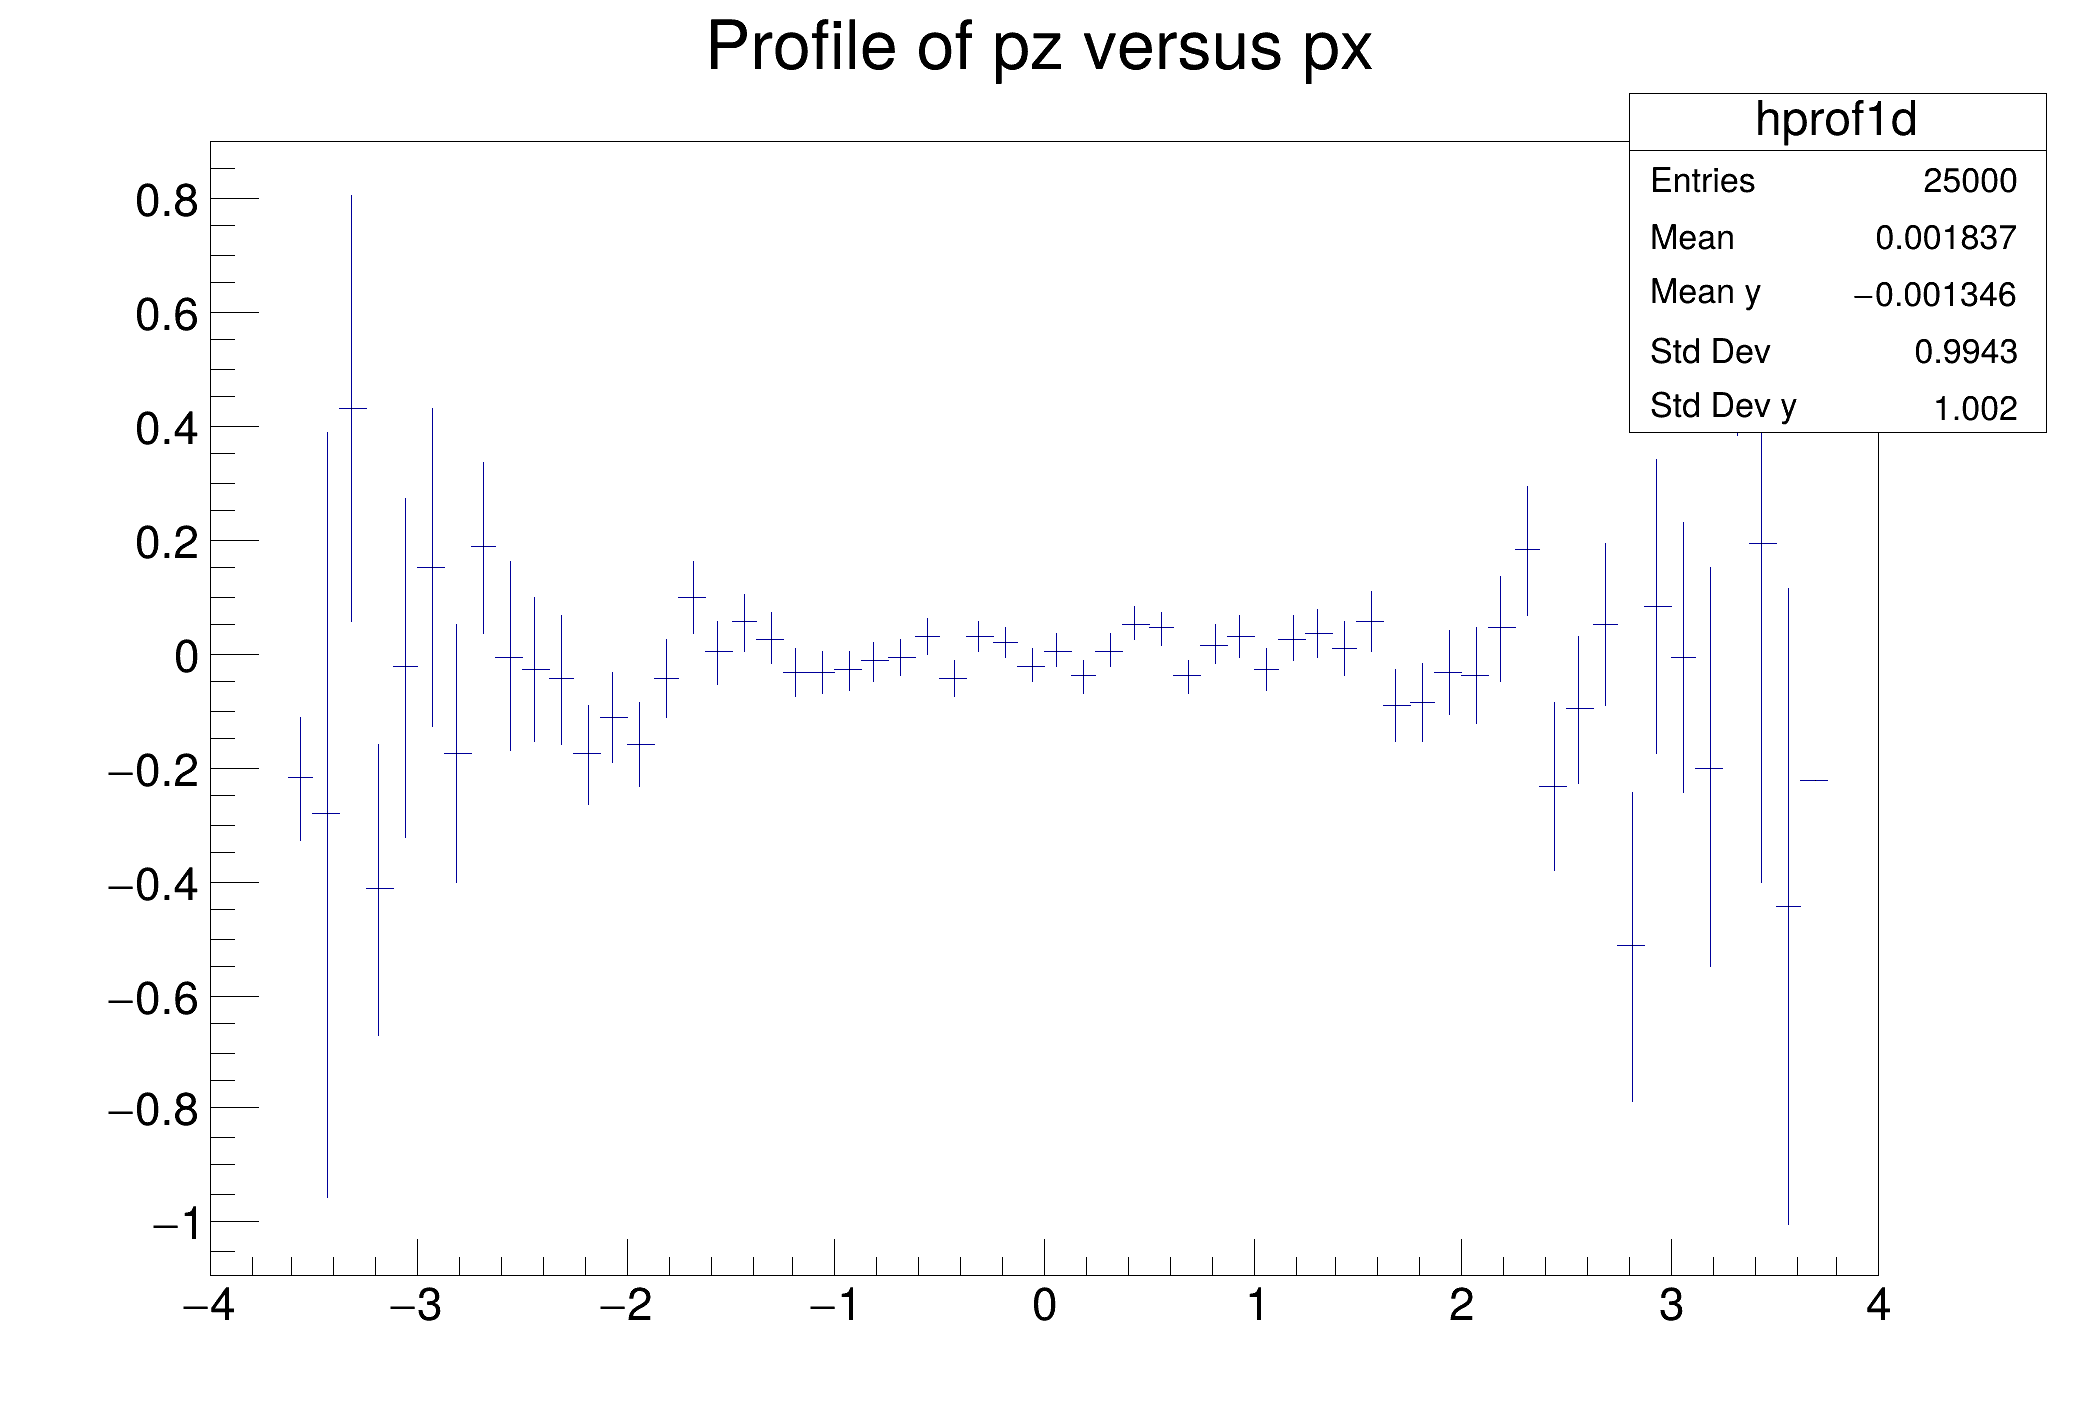
hprof1d = d.Profile1D(("hprof1d", "Profile of pz versus px", 64, -4, 4), "px", "py")
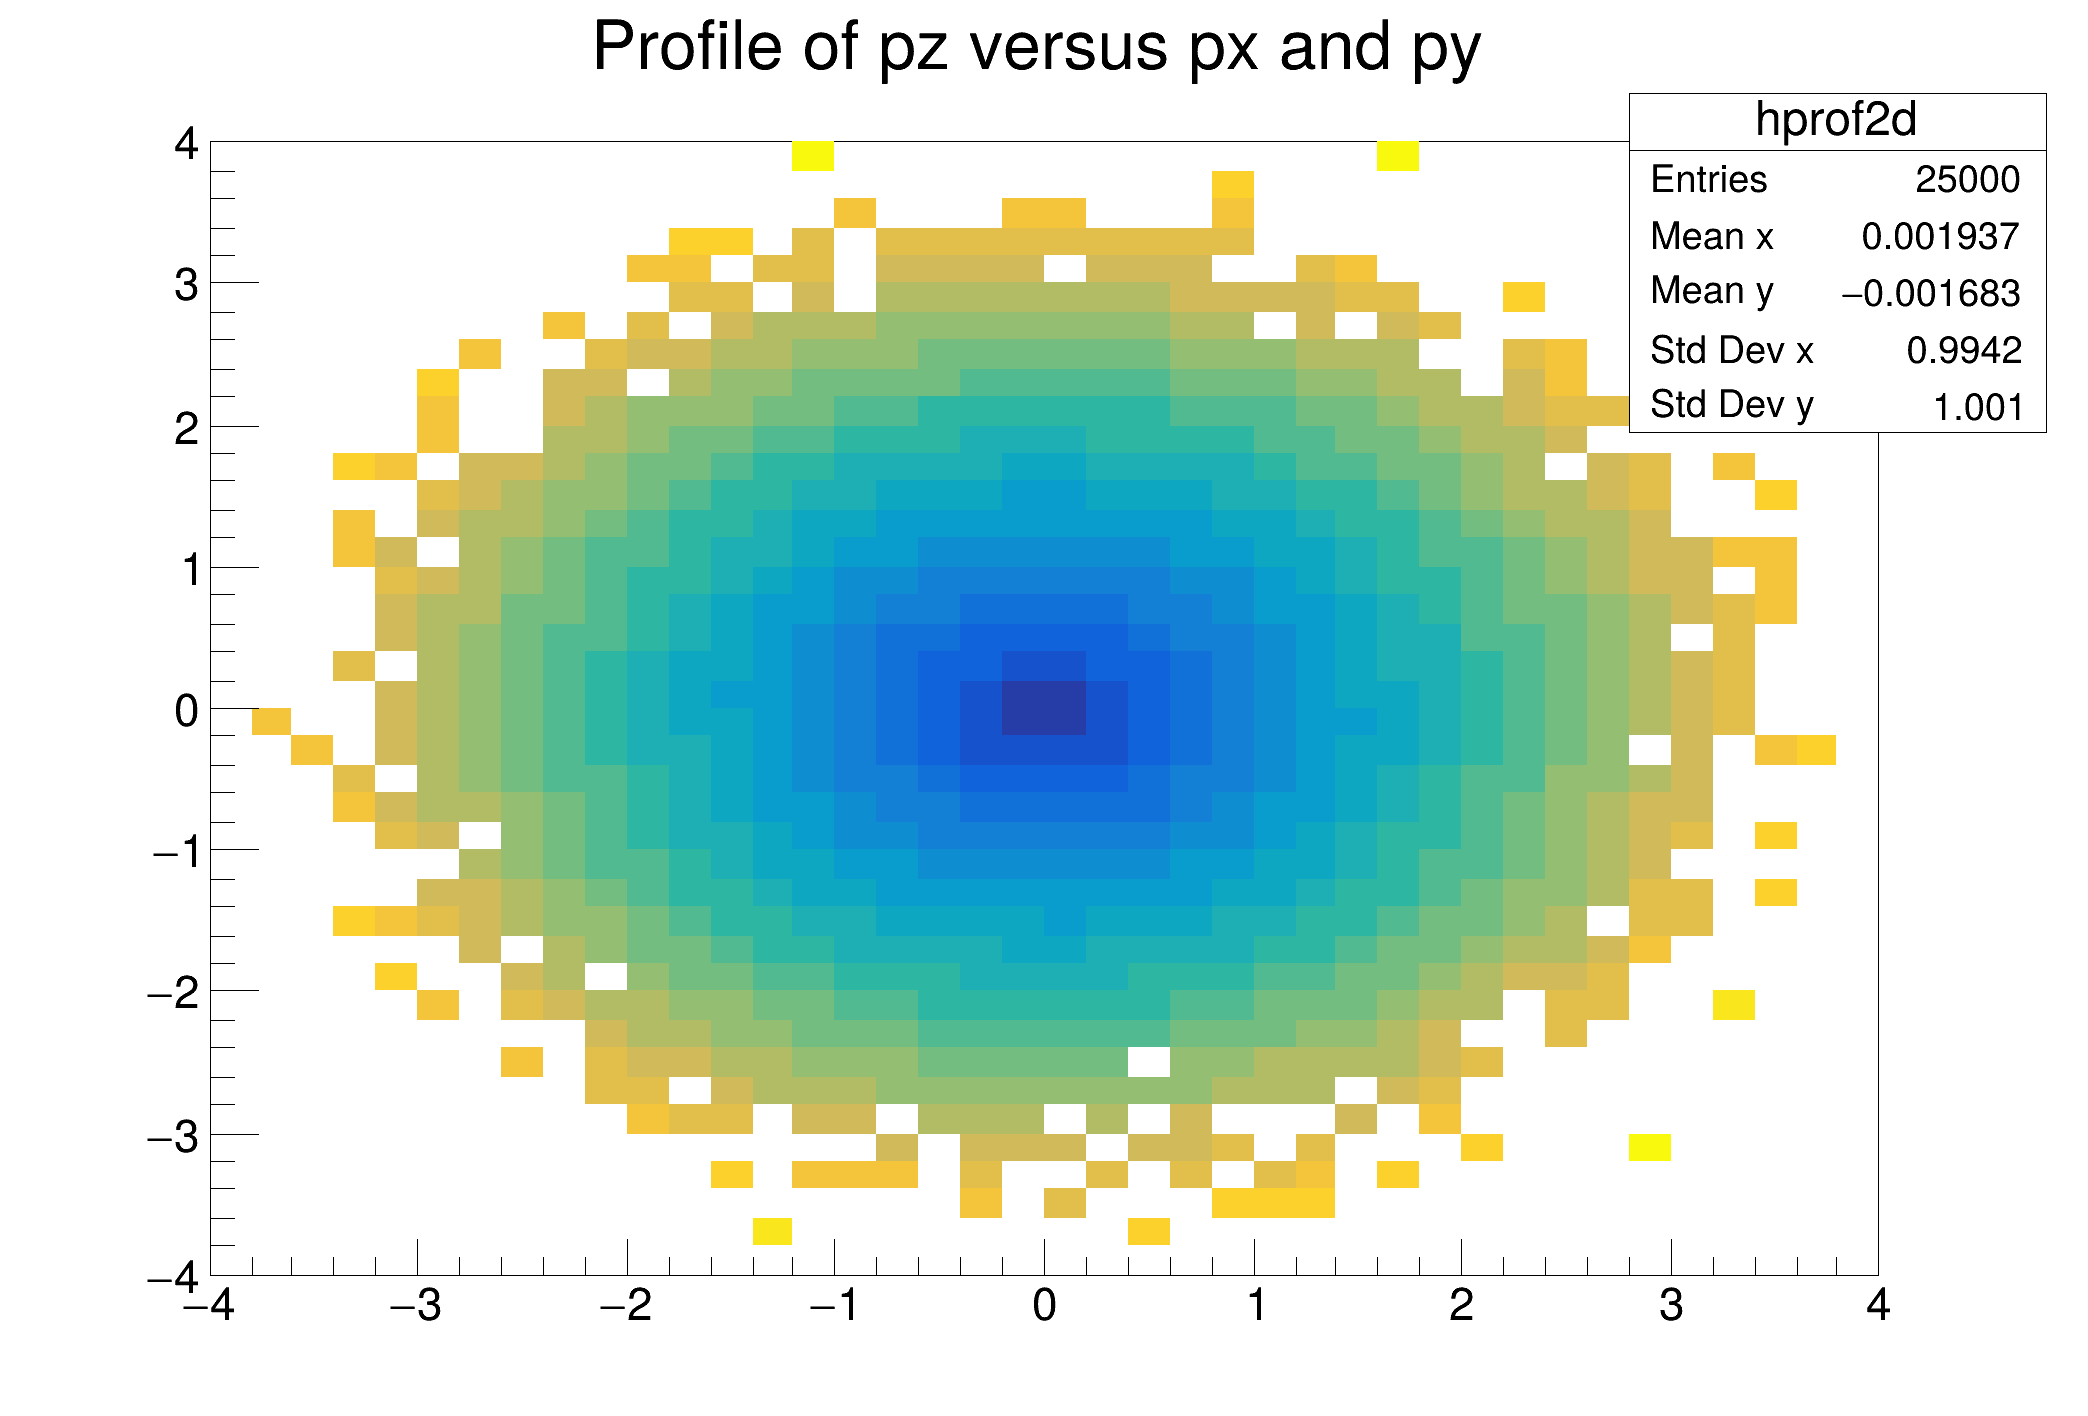
hprof2d = d.Profile2D(("hprof2d", "Profile of pz versus px and py", 40, -4, 4, 40, -4, 4, 0, 20), "px", "py", "pz")
c1 = ROOT.TCanvas("c1", "Profile histogram example", 200, 10, 700, 500)
hprof1d.Draw()
c1.SaveAs("df003_c1.png")
c2 = ROOT.TCanvas("c2", "Profile2D histogram example", 200, 10, 700, 500)
hprof2d.Draw()
c2.SaveAs("df003_c2.png")
print("Saved figures to df003_*.png")
RInterface< Proxied, DS_t > Define(std::string_view name, F expression, const ColumnNames_t &columns={})
Define a new column.
ROOT's RDataFrame offers a modern, high-level interface for analysis of data stored in TTree ,...