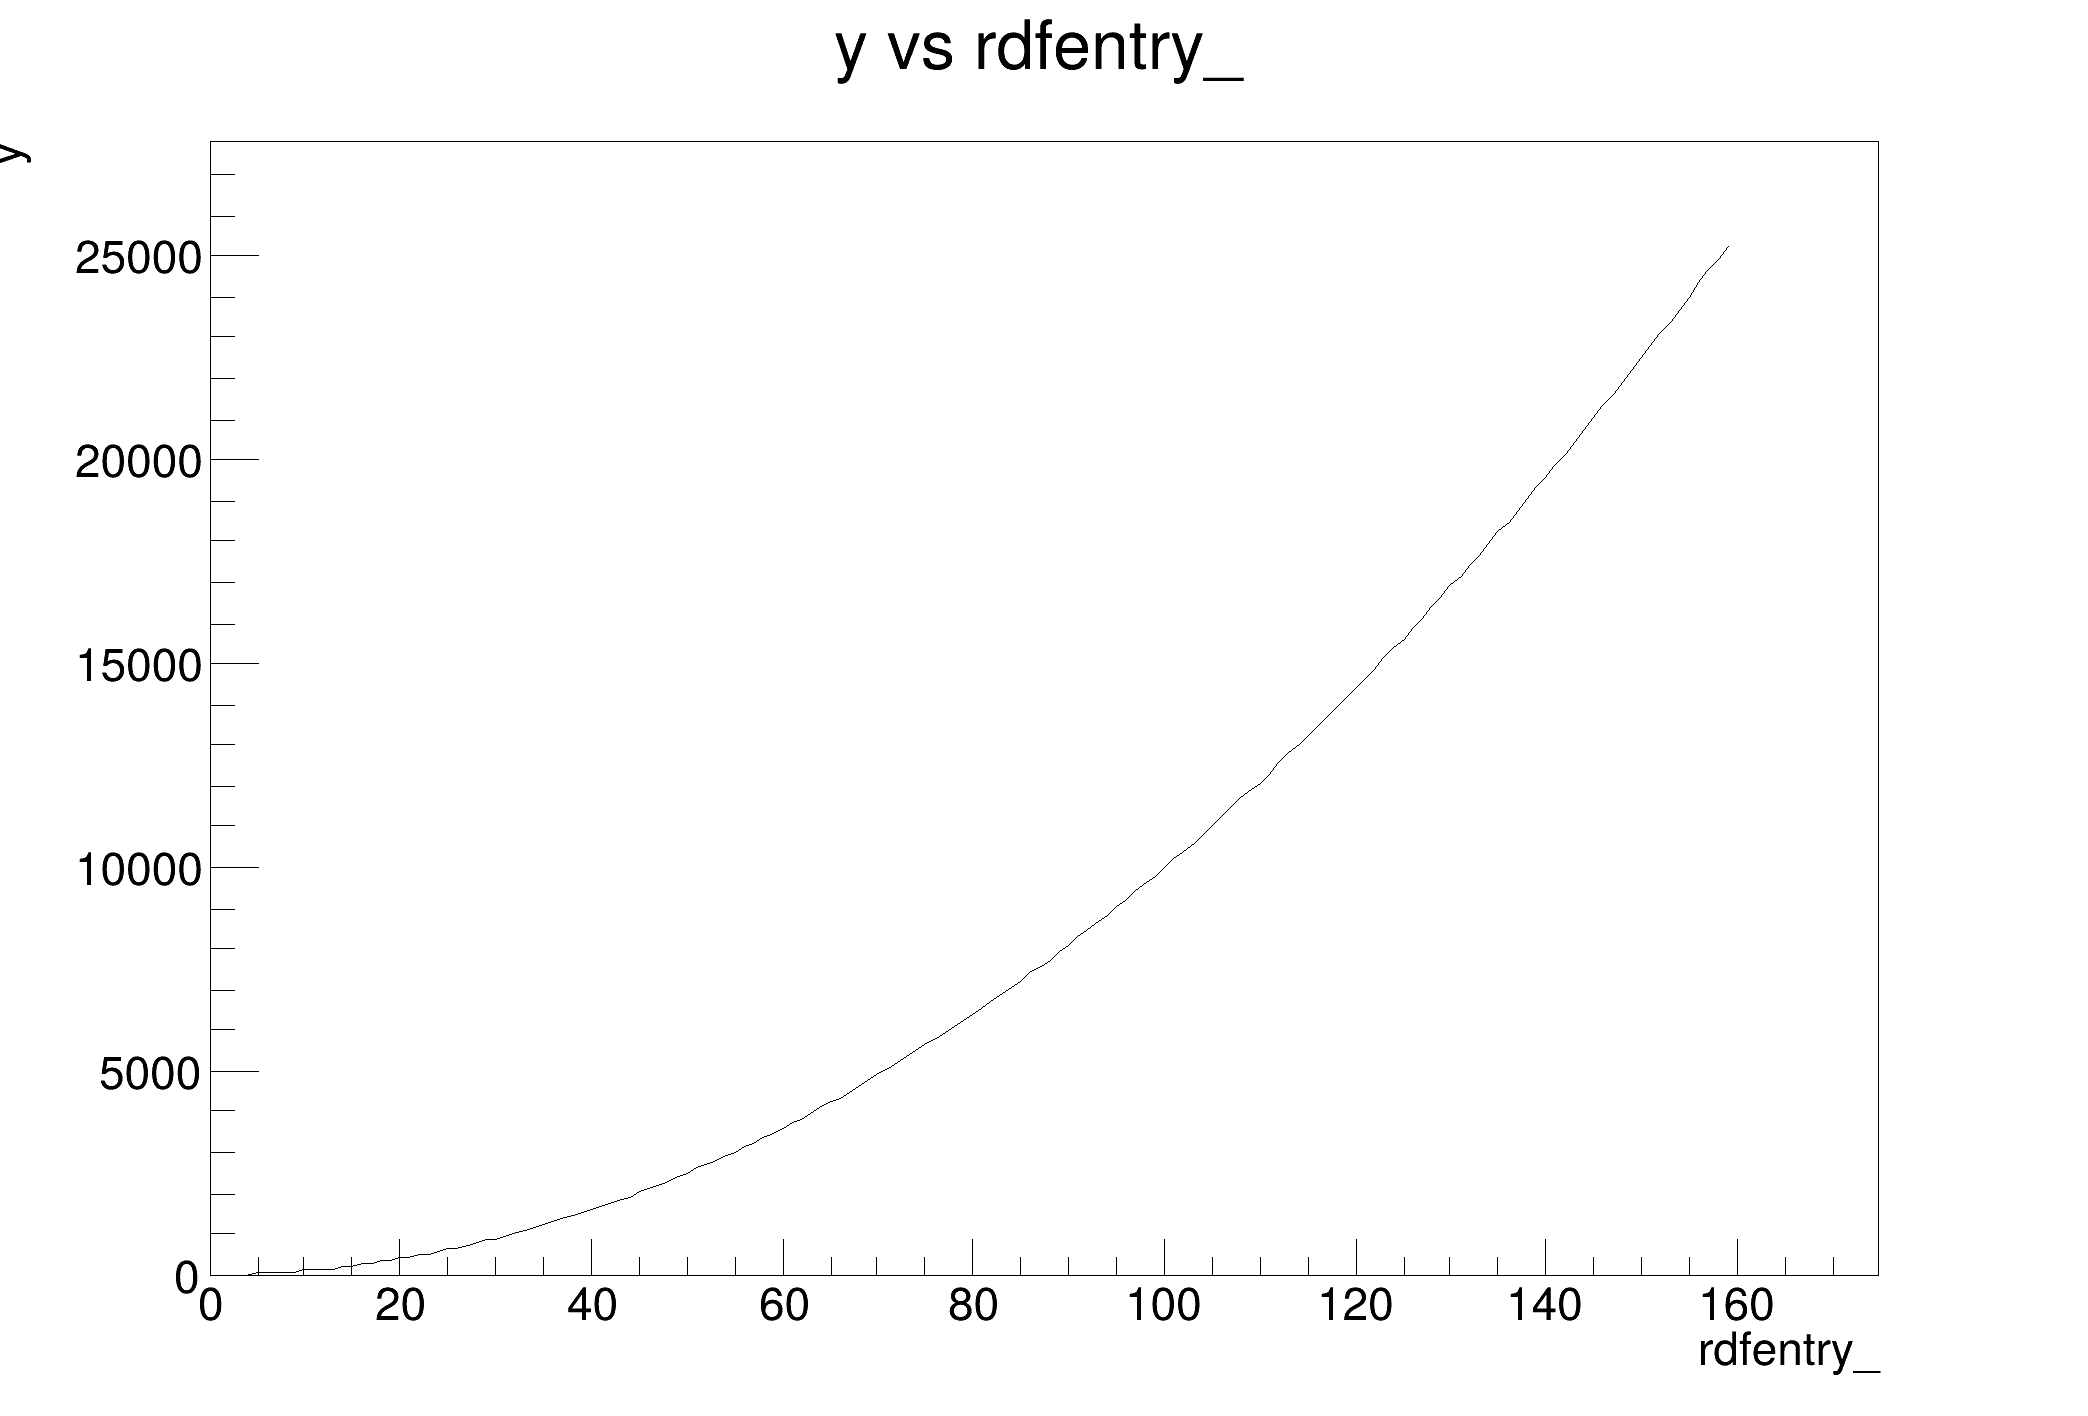

Fill a TGraph using RDataFrame.
import ROOT
dd =
d.Alias(
"x",
"rdfentry_").Define(
"y",
"x*x")
print("Saved figure to df021_createTGraph.png")
ROOT::Detail::TRangeCast< T, true > TRangeDynCast
TRangeDynCast is an adapter class that allows the typed iteration through a TCollection.
ROOT's RDataFrame offers a modern, high-level interface for analysis of data stored in TTree ,...
- Date
- July 2018
- Authors
- Enrico Guiraud, Danilo Piparo (CERN), Massimo Tumolo (Politecnico di Torino)
Definition in file df021_createTGraph.py.


