
Histograms filled and drawn in a loop.
Simple example illustrating how to use the C++ interpreter to fill histograms in a loop and show the graphics results
{
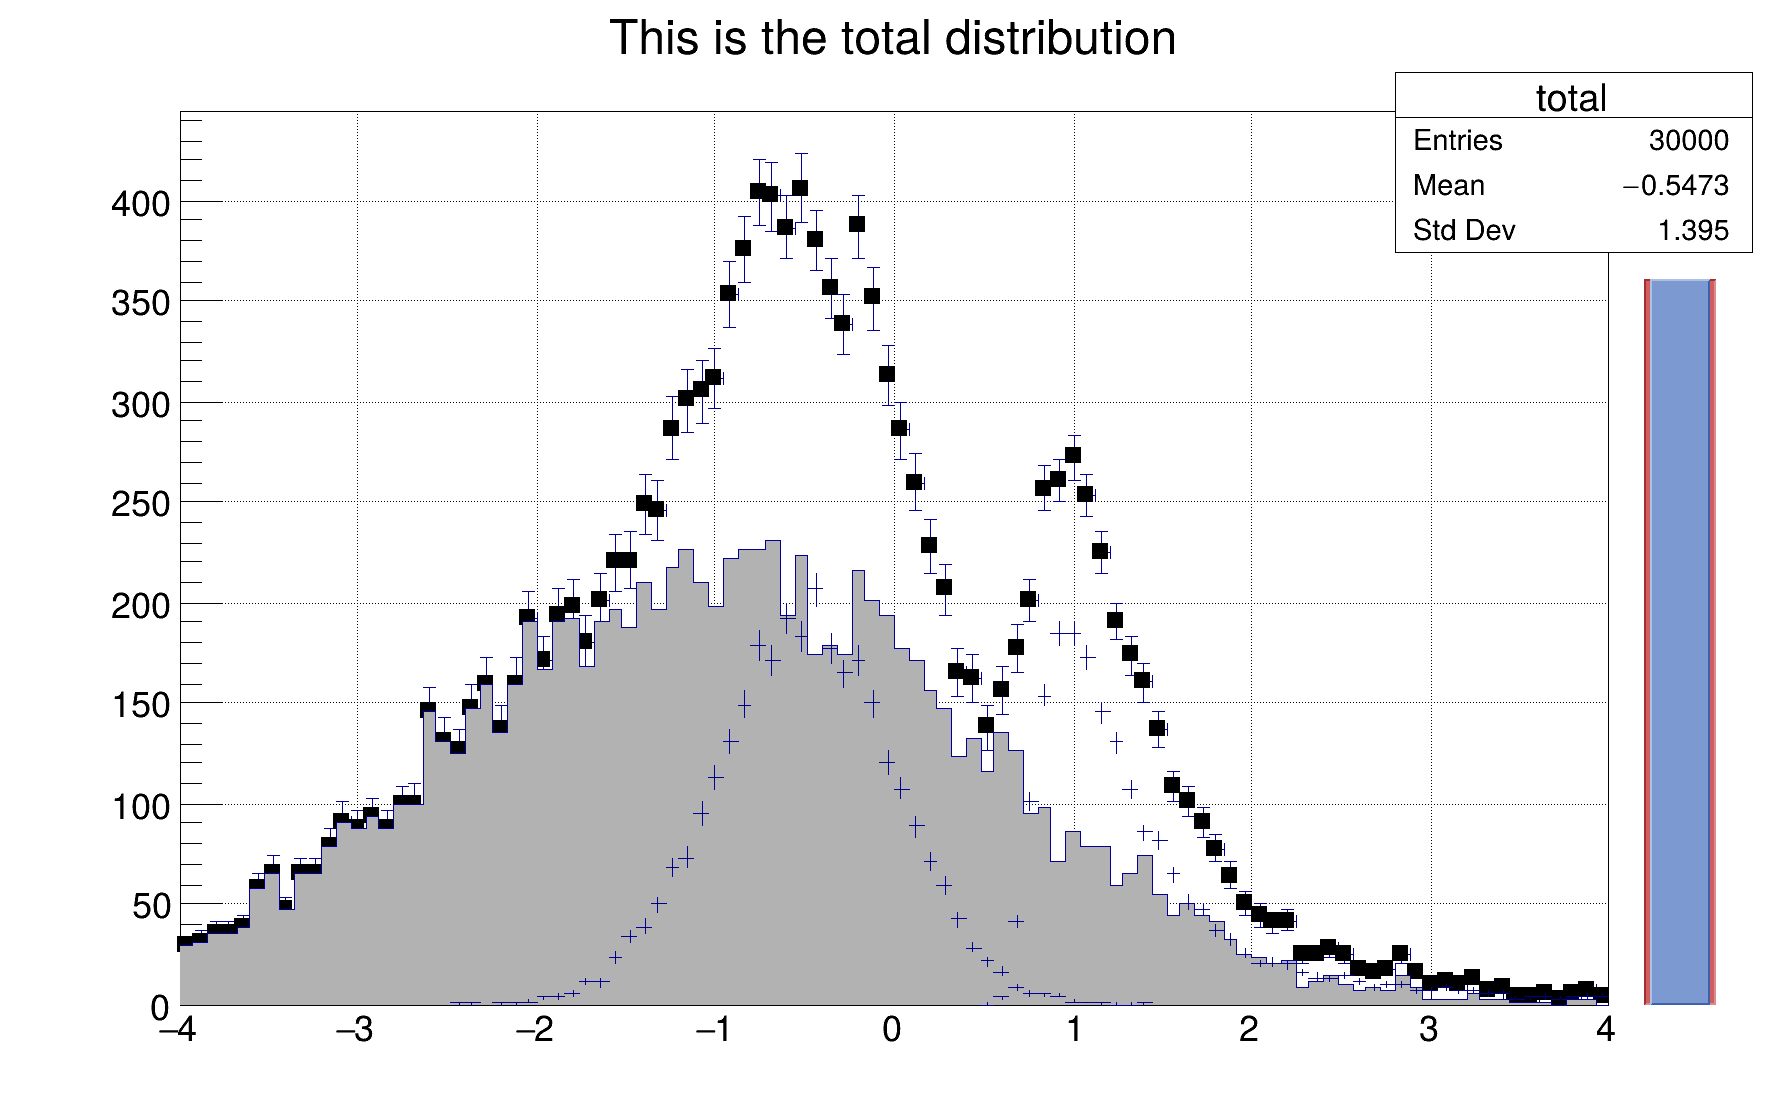
auto total =
new TH1F(
"total",
"This is the total distribution",100,-4,4);
auto main =
new TH1F(
"main",
"Main contributor",100,-4,4);
auto s1 =
new TH1F(
"s1",
"This is the first signal",100,-4,4);
auto s2 =
new TH1F(
"s2",
"This is the second signal",100,-4,4);
total->SetMarkerStyle(21);
total->SetMarkerSize(0.7);
s2->SetFillColor(46);
s2->Fill(xs2,0.2);
s2->Draw("same");
"test",4.2,0,4.6,
total->GetMaximum(),38);
}
if (slider) slider->
SetRange(0., 1.*
i/10000.);
}
}
}
R__EXTERN TBenchmark * gBenchmark
static unsigned int total
R__EXTERN TRandom * gRandom
int main(int argc, char *argv[])
virtual void SetFillColor(Color_t fcolor)
Set the fill area color.
1-D histogram with a float per channel (see TH1 documentation)
A specialized TPad including a TSliderBox object.
virtual void SetRange(Double_t xmin=0, Double_t xmax=1)
Set Slider range in [0,1].
- Author
- Rene Brun
Definition in file hsum.C.