Logo ROOT  
Reference Guide
 
Loading...
Searching...
No Matches
ratioplot4.C File Reference

Detailed Description

View in nbviewer Open in SWAN
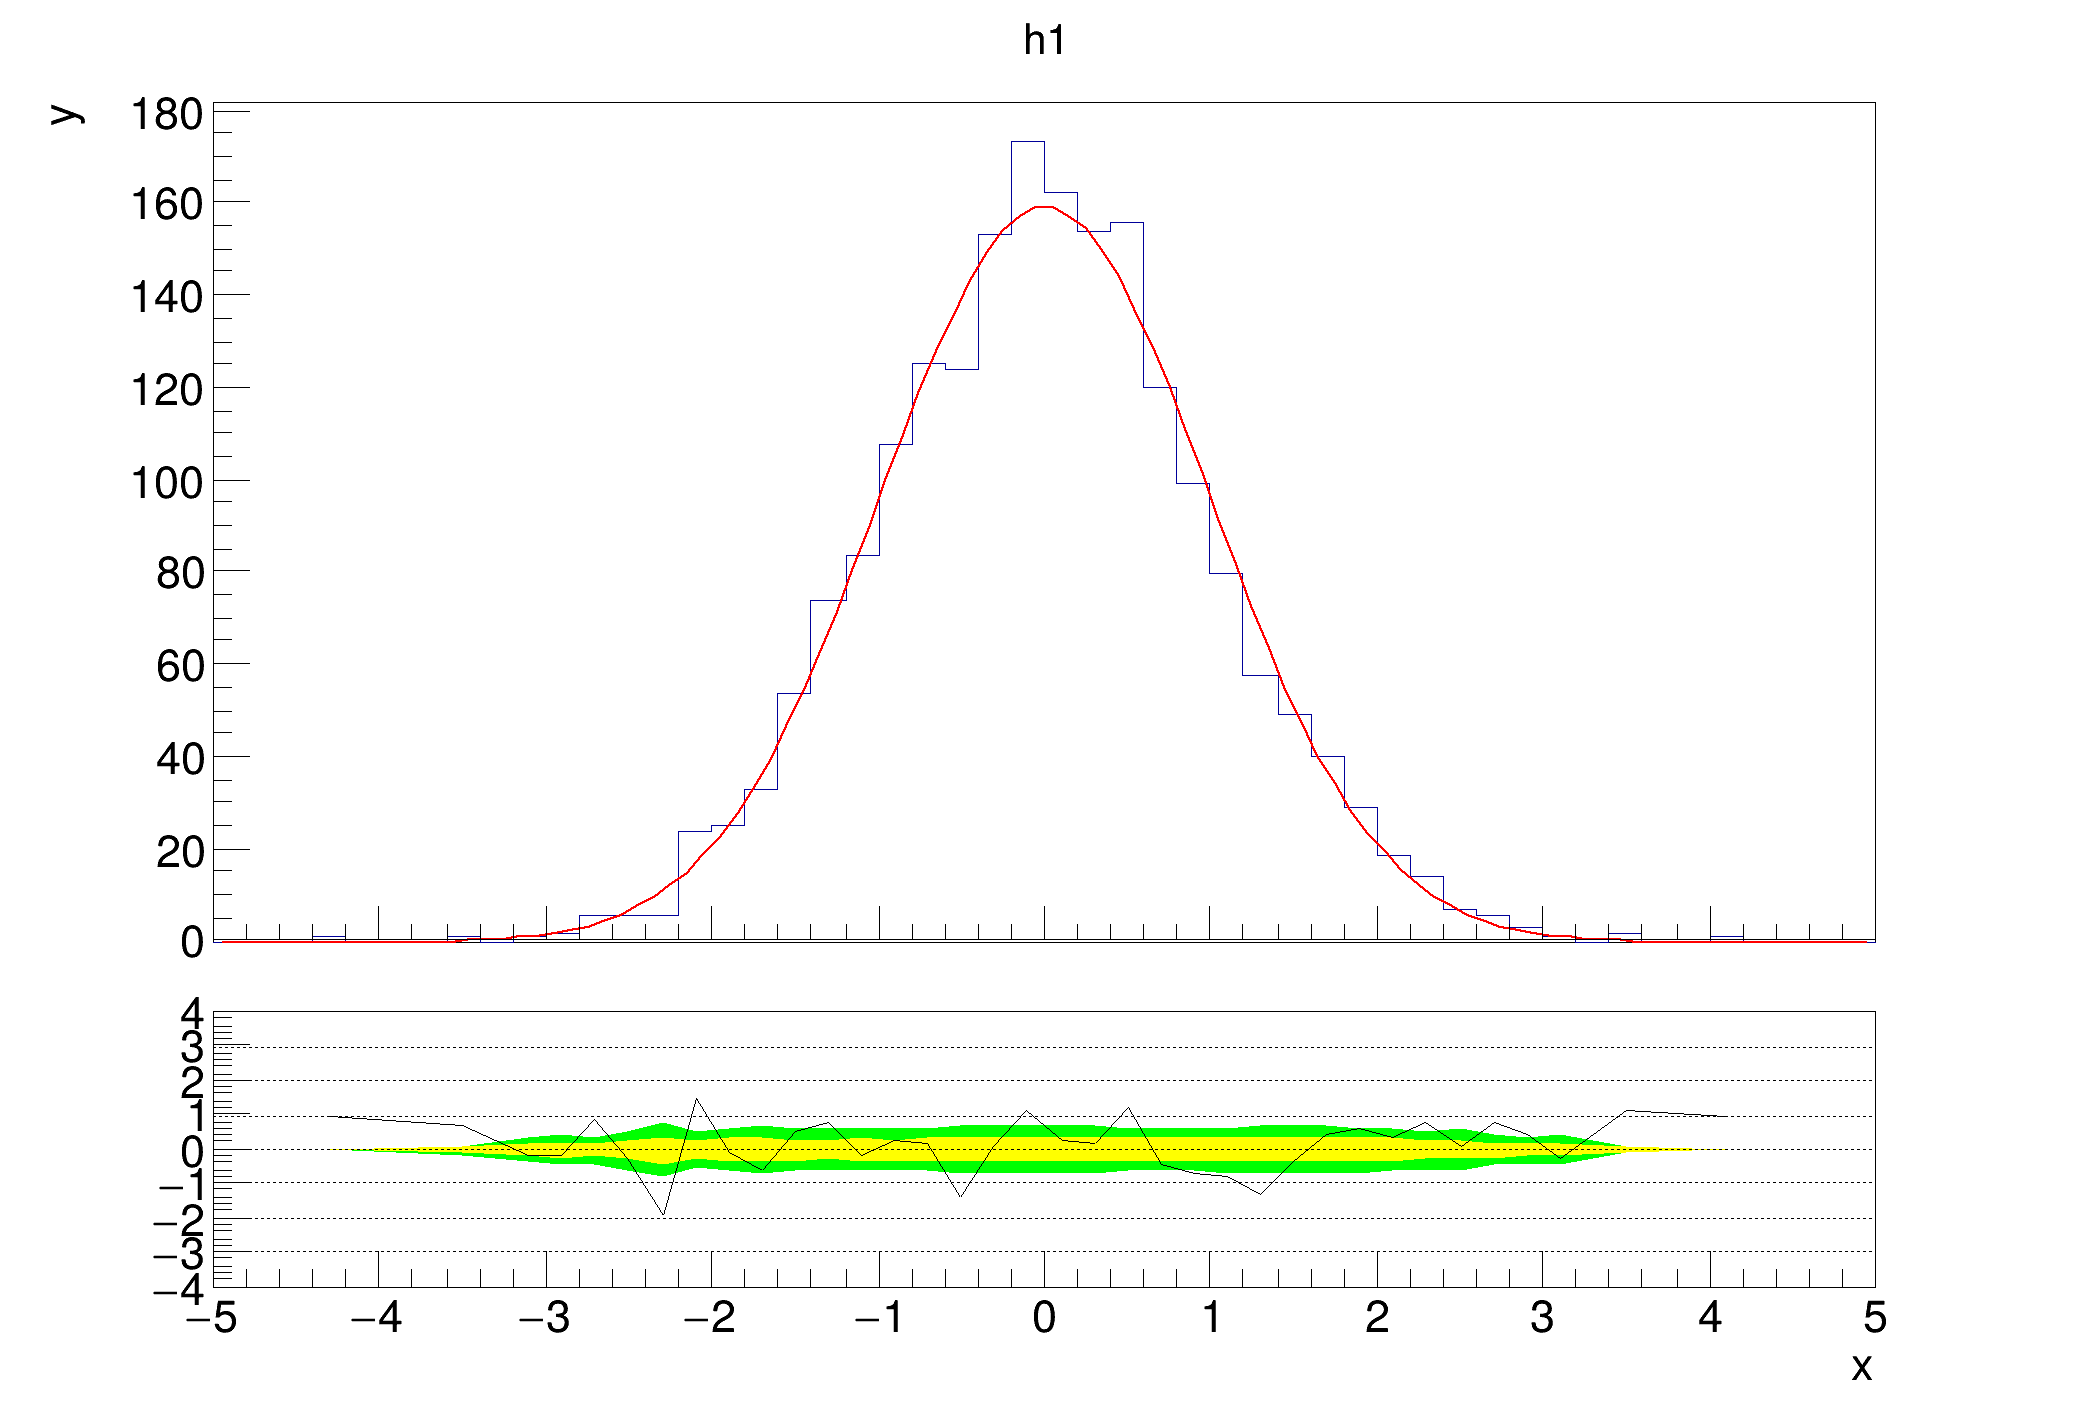
Example that shows custom dashed lines on the lower plot, specified by a vector of floats.

By default, dashed lines are drawn at certain points. You can either disable them, or specify where you want them to appear.

void ratioplot4() {
gStyle->SetOptStat(0);
auto c1 = new TCanvas("c1", "fit residual simple");
auto h1 = new TH1D("h1", "h1", 50, -5, 5);
h1->FillRandom("gaus", 2000);
h1->Fit("gaus", "0");
h1->GetXaxis()->SetTitle("x");
h1->GetYaxis()->SetTitle("y");
auto rp1 = new TRatioPlot(h1);
std::vector<double> lines = {-3, -2, -1, 0, 1, 2, 3};
rp1->SetGridlines(lines);
rp1->Draw();
rp1->GetLowerRefGraph()->SetMinimum(-4);
rp1->GetLowerRefGraph()->SetMaximum(4);
}
R__EXTERN TStyle * gStyle
Definition TStyle.h:433
The Canvas class.
Definition TCanvas.h:23
1-D histogram with a double per channel (see TH1 documentation)
Definition TH1.h:669
Class for displaying ratios, differences and fit residuals.
Definition TRatioPlot.h:43
return c1
Definition legend1.C:41
TH1F * h1
Definition legend1.C:5
Author
Paul Gessinger

Definition in file ratioplot4.C.