
 Histograms filled and drawn in a loop.
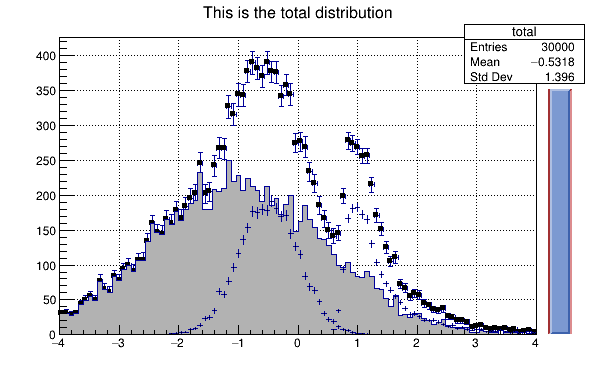
Simple example illustrating how to use the C++ interpreter to fill histograms in a loop and show the graphics results
void hsum() {
auto total =
new TH1F(
"total",
"This is the total distribution",100,-4,4);
auto main =
new TH1F(
"main",
"Main contributor",100,-4,4);
auto s1 =
new TH1F(
"s1",
"This is the first signal",100,-4,4);
auto s2 =
new TH1F(
"s2",
"This is the second signal",100,-4,4);
total->Sumw2();
main->SetFillColor(16);
s1->SetFillColor(42);
s2->SetFillColor(46);
const Int_t kUPDATE = 500;
for (
Int_t i=0; i<10000; i++) {
main->Fill(xmain);
s1->Fill(xs1,0.3);
s2->Fill(xs2,0.2);
total->Fill(xmain);
total->Fill(xs1,0.3);
total->Fill(xs2,0.2);
if (i && (i%kUPDATE) == 0) {
if (i == kUPDATE) {
s1->Draw("same");
s2->Draw("same");
}
}
}
}
- Author
- Rene Brun
Definition in file hsum.C.

 ROOT 6.10/09 - Reference Guide Generated on Thu May 31 2018 12:11:11 using Doxygen 1.8.13.