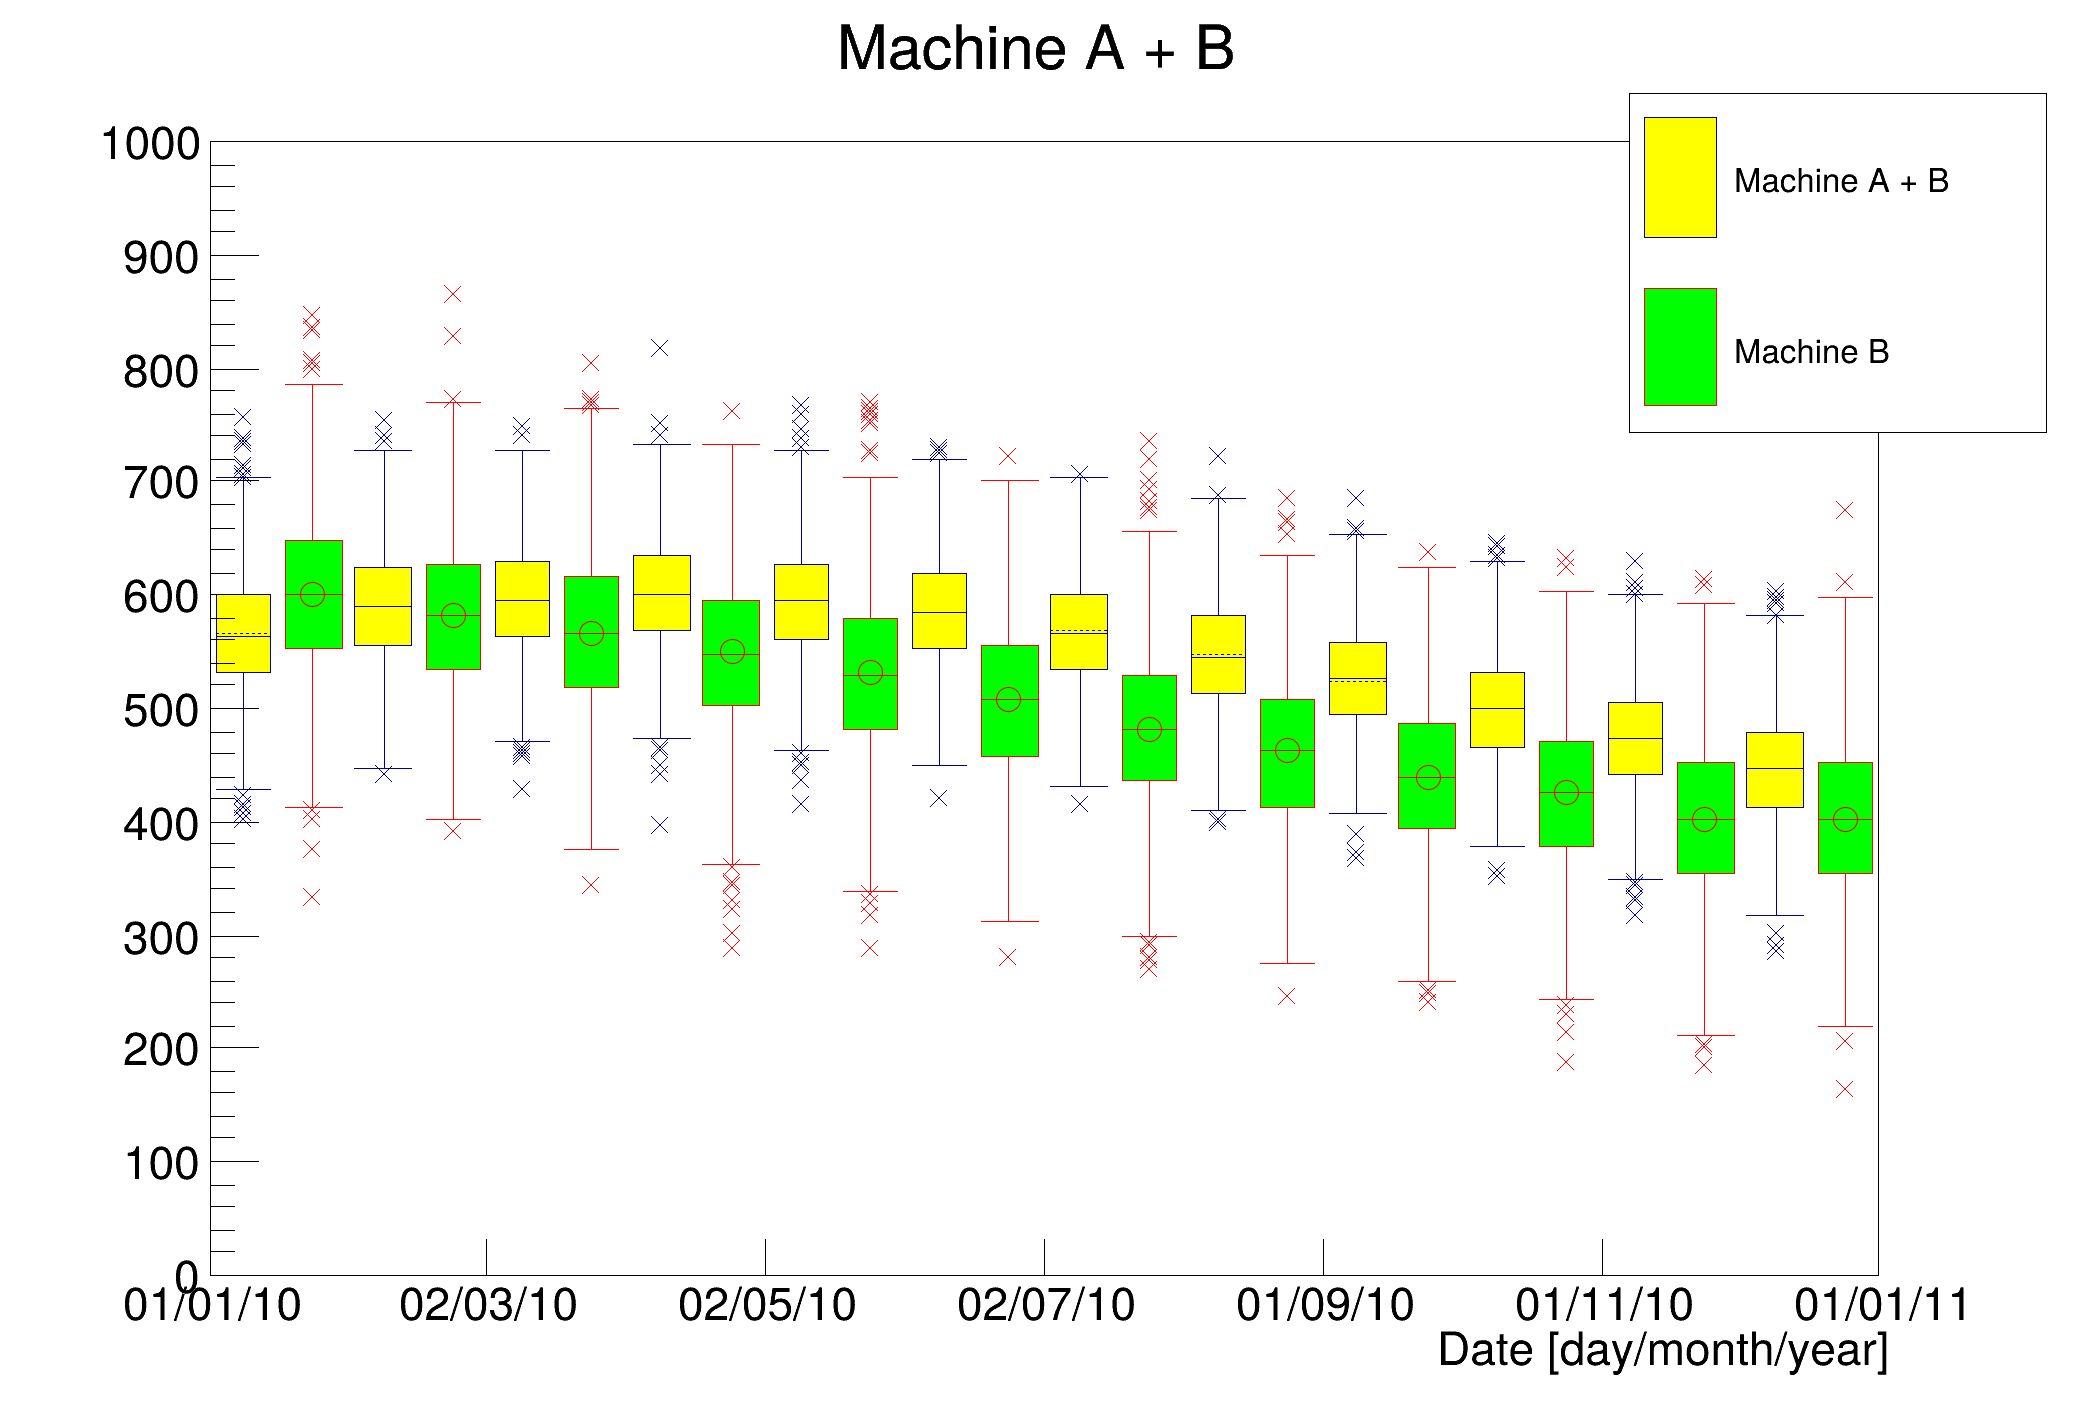

Example of candle plot with 2-D histograms.
void candleplot() {
auto h1 =
new TH2I(
"h1",
"Machine A + B",12,dateBegin.Convert(),dateEnd.Convert(),1000,0,1000);
auto h2 =
new TH2I(
"h2",
"Machine B",12,dateBegin.Convert(),dateEnd.Convert(),1000,0,1000);
h1->GetXaxis()->SetTimeDisplay(1);
h1->GetXaxis()->SetTimeFormat(
"%d/%m/%y");
h1->GetXaxis()->SetNdivisions(-6);
h1->GetXaxis()->SetTitle(
"Date [day/month/year]");
float Rand;
for (
int i = dateBegin.Convert();
i < dateEnd.Convert();
i+=86400*30) {
for (int j = 0; j < 1000; j++) {
Rand =
gRandom->Gaus(500+sin(
i/10000000.)*100,50);
h1->Fill(
i,Rand);
Rand =
gRandom->Gaus(500+sin(
i/11000000.)*100,70); h2->Fill(
i,Rand);
}
}
h2->Draw(
"candle3 same");
gPad->BuildLegend(0.78,0.695,0.980,0.935,
"",
"f");
}
R__EXTERN TRandom * gRandom
R__EXTERN TStyle * gStyle
This class stores the date and time with a precision of one second in an unsigned 32 bit word (950130...
2-D histogram with an int per channel (see TH1 documentation)
- Author
- Georg Troska
Definition in file candleplot.C.