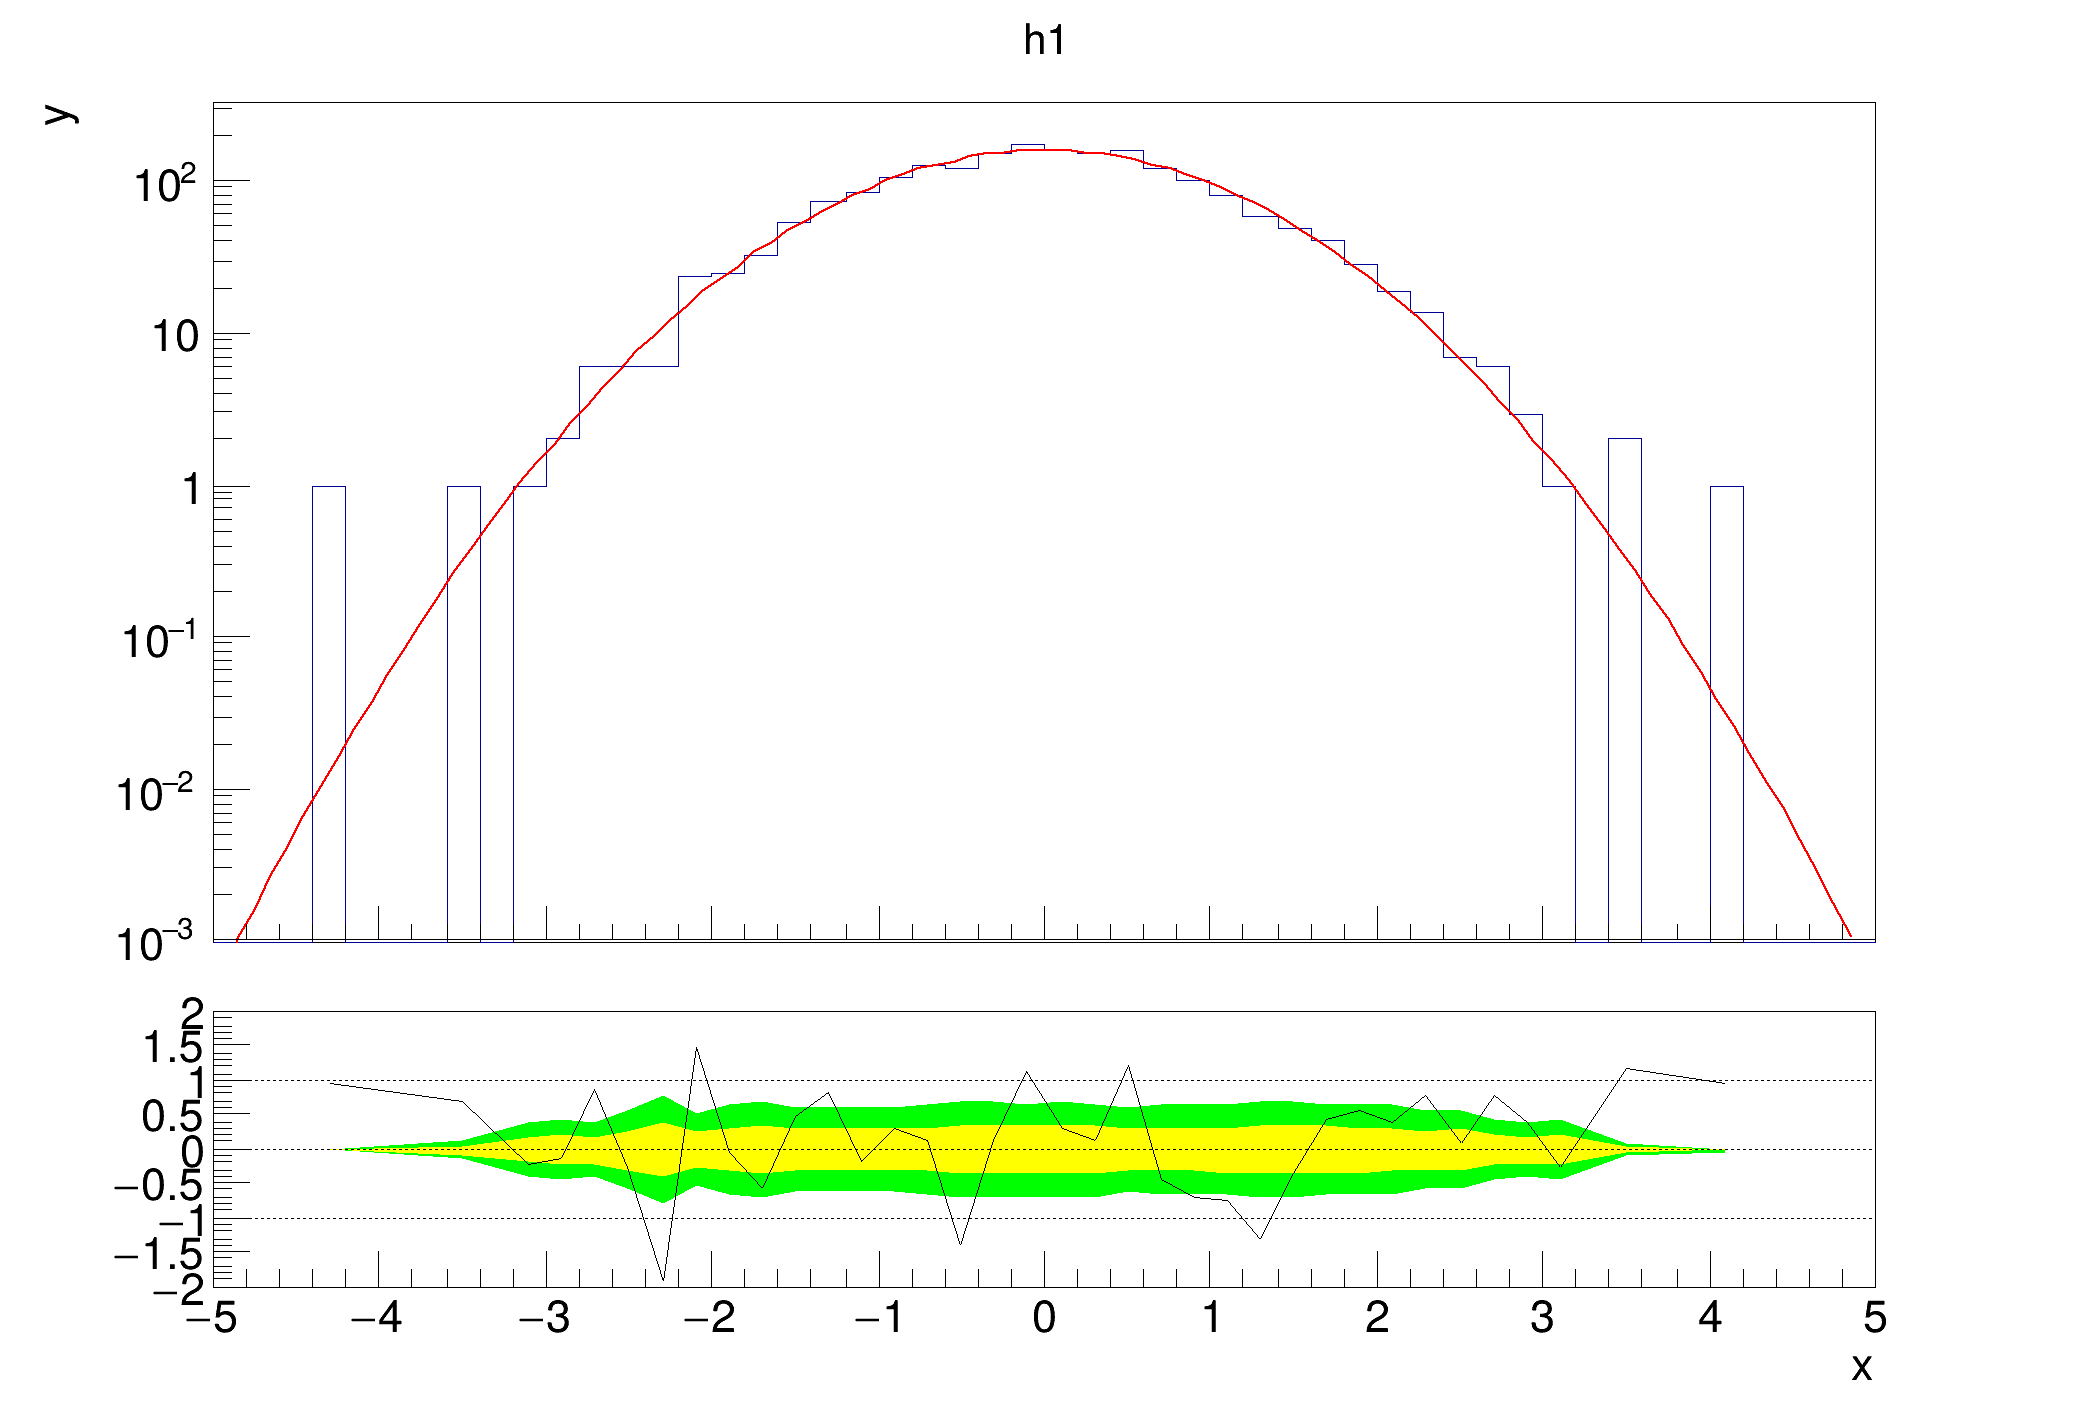
Example which shows how you can get the graph of the lower plot and set the y axis range for it.
Since the lower plot is not created until TRatioPlot::Draw is called, you can only use the method afterwards.
auto c1 =
new TCanvas(
"c1",
"fit residual simple");
auto h1 =
new TH1D(
"h1",
"h1", 50, -5, 5);
h1->FillRandom(
"gaus", 2000);
h1->GetXaxis()->SetTitle(
"x");
h1->GetYaxis()->SetTitle(
"y");
rp1->Draw();
rp1->GetLowerRefGraph()->SetMinimum(-2);
rp1->GetLowerRefGraph()->SetMaximum(2);
}
R__EXTERN TStyle * gStyle
1-D histogram with a double per channel (see TH1 documentation)
Class for displaying ratios, differences and fit residuals.
- Author
- Paul Gessinger
Definition in file ratioplot3.C.