
Efficiency
Basically all analyses involve selections on parameters - as an example we will use the trigger selecting muons above a certain pT. Ideally, these selections suppress all events that have no muon above this pT, and include all events with at least one muon that has more than the cut pT. The first image above shows an ideal selection efficiency: below the cutoff value (here, "5") it selects nothing (0% efficiency), above it selects everything (100% efficiency).
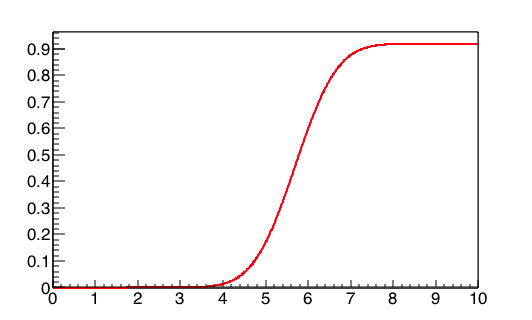
In reality, the efficiency is often rising more or less slowly from 0% efficiency to its maximum efficiency value - which is usually below 100%. And the center of the rising curve is often not exactly at the cut value. Such an example is shown in the lower image. Determining efficiency from data
Suppose we want to determine the muon trigger efficiency versus muon pT. We could look at how many muons are triggered on given a certain muon pT bin (pass) over how many muons are overall - triggered or not - in that pT bin (all).
But this won't work: we will never see those events that have not a single muon triggered - because in our data sample, only events with at least one muon trigger are saved! And so we would underestimate the all part. Our sample is "biased" against the muon trigger, because it requires events to be muon triggered.
The trick is to remove this "bias" from our data sample. The approach is called:
Tag and Probe
We take a random muon (the tag muon). If that has been seen by the trigger we know that the other muons have not been influenced by the trigger: we have satisfied the condition already with the tag muon. All other muons will now allow us to calculate the actual efficiency, but histogramming their pT in all and if it has fired the trigger also in pass.
TEfficiency
Instead of having to create two histograms for pass and all, and instead of having to search through ROOT how to build the ratio (and its uncertainty!) correctly (think of bins with 0 content) we can simply use TEfficiency. It behaves like a histogram; you fill it with the information whether it is part of the pass sample (or only part of the all sample) as first argument and with its pT value as second argument.
The script here shows how to do this - except for the TEfficiency::Fill() statement that you can probably do yourself!
// Save e.g. in effX.C

#include "TEfficiency.h"
#include "TF1.h" // we'll need this later...
#include "TFile.h"
#include "TMath.h"
#include "TRandom.h"
#include "TTreeReader.h"
#include "TTreeReaderArray.h"

void effX() {
   TEfficiency* eff
      = new TEfficiency("eff", "Moun trigger efficiency", 100, 0., 10.);

   TFile* file
      = TFile::Open("http://root.cern.ch/root/files/tutorials/mockupx.root");
   TTreeReader reader("MyTree", file);

   TTreeReaderArray<double> raPt(reader, "muons.fPt");
   TTreeReaderArray<bool> raTriggered(reader, "muons.fTriggered");

   while (reader.Next()) {
      // Select a tag muon between [0..numberOfMuons[.
      int tagMuon = gRandom->Integer(raPt.GetSize());
      if (raTriggered[tagMuon]) {
         for (int iMuon = 0, nMuons = raPt.GetSize(); iMuon < nMuons; ++iMuon) {
            // All but the tag muon can be probe muons
            if (iMuon != tagMuon) {
               // Fill the efficiency object with
               // - whether this muon has triggered
               // - the pT of this muon.
               eff->Fill(???);
            }
         }
      }
   }

   eff->Draw();
}
