What is a histogram?
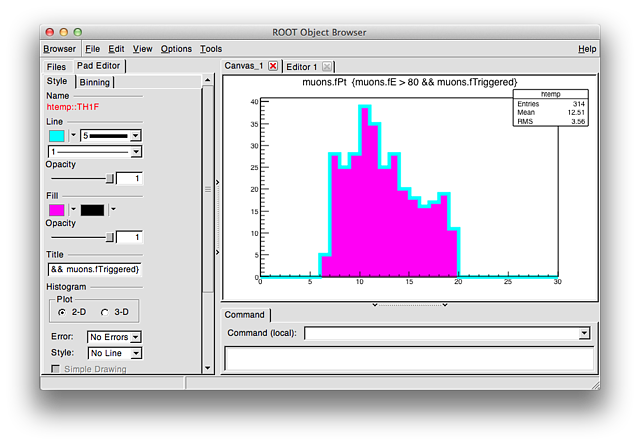
Our TTree contains for instance the energy of all electrons. What we usually care about is its distribution - for instance by counting how often electrons have an energy within a certain range. Such a range is called "bin". Let's look at an example: draw the histogram of the momentum ("fPt") of all electrons with an energy ("fE") > 80 and fTriggered being true. Binning
You can tell TTree::Draw() what the binning should be:
tree->Draw("electrons.fE >> htemp(15, 0., 30.)",...)
will use 15 bins, where the lower bin border of the first bin is at 0. and the upper bin border of the highest is at 30.
Style
ROOT displays a few properties for the histogram in the box in the upper right. You can move things around in the graphical display ("canvas") of the histogram. You can modify graphical properties of the canvas by showing the editor: in the menu, select "View", then "Editor". Click on the histogram to select it, then change its visual appearance to magenta line, 5 pixels width, with pink fill. Eeew. This is likely the only time in your life that you are allowed to use this color combination - enjoy! :-)
