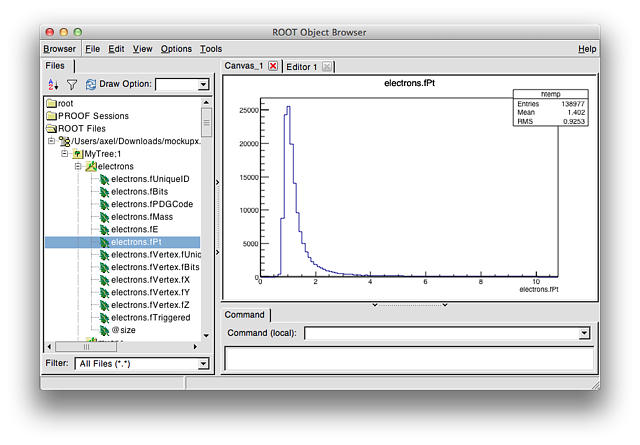
The TTree
A TTree is a collection of similar data. It is the collection used by basically all High Energy Physics data. Traditionally, each entry in a TTree corresponds to a collision event. (Notable exceptions at the LHC are ALICE and LHCb which have a different mapping of TTree entries.) The experiments make their data available to physicists as TTrees, after pre-processing (reconstruction) and filtering (triggering, slimming and skimming). We will start with how to explore that data. TBrowser
ROOT has an interface similar to a "file explorer" which can also show the structure of TTrees. After opening the file you run new TBrowser to open it. In the left tab you can select the file. Double clicking it will expand it. You will see what kind of data the tree contains. Continue until you double click on "electrons.fPt" - this will create a histogram of the data as shown in the image above. Branches and their Data
The structures inside the tree are called "branches" (e.g. "electrons", "muons" but also "pions.fPt"); the leaf branches (e.g. "muons.fPt") contain data that you can draw. Instead of using the TBrowser you can also use C++:
tree->Draw("muons.fPt")
This will again produce a histogram, now for the muons momentum. Note that MockupX is an imaginary but terrible experiment, its data doesn't make much sense - but for examining how to analyze it's just fine.
Selections
You define what data to draw (the muons' momentum in above example). But you might also want to not draw the value for all muons, but only for selected one - for example for those that have an electron in the event that has caused the experiment's trigger ("yes we want to keep this data!") do fire. You do that with a second parameter:
tree->Draw("muons.fPt", "electrons.fTriggered")
As you now restrict the drawn electrons to a subset of the original ones, you should see that there are less entries in the histogram. Did that work?

