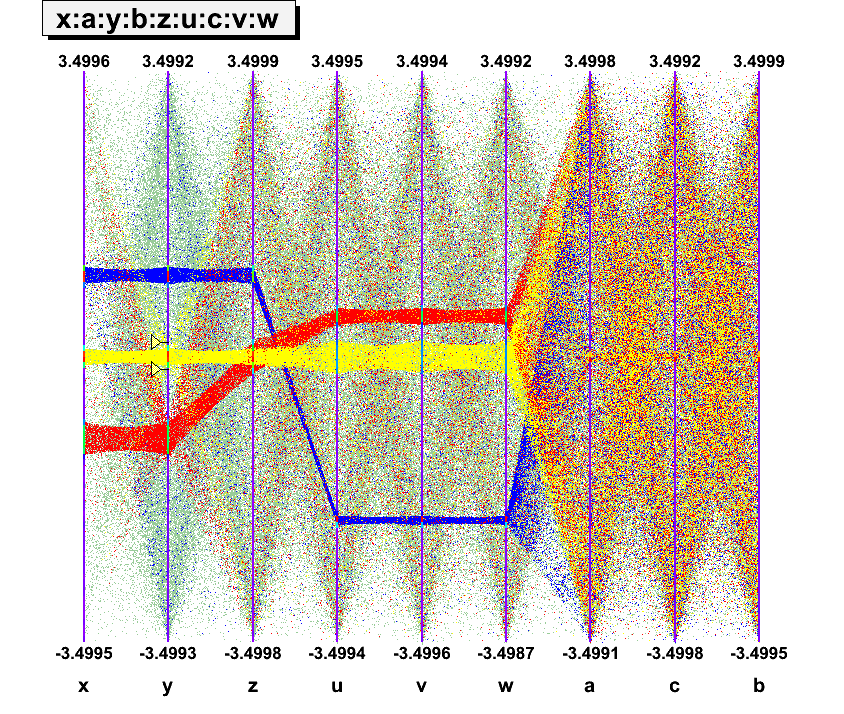
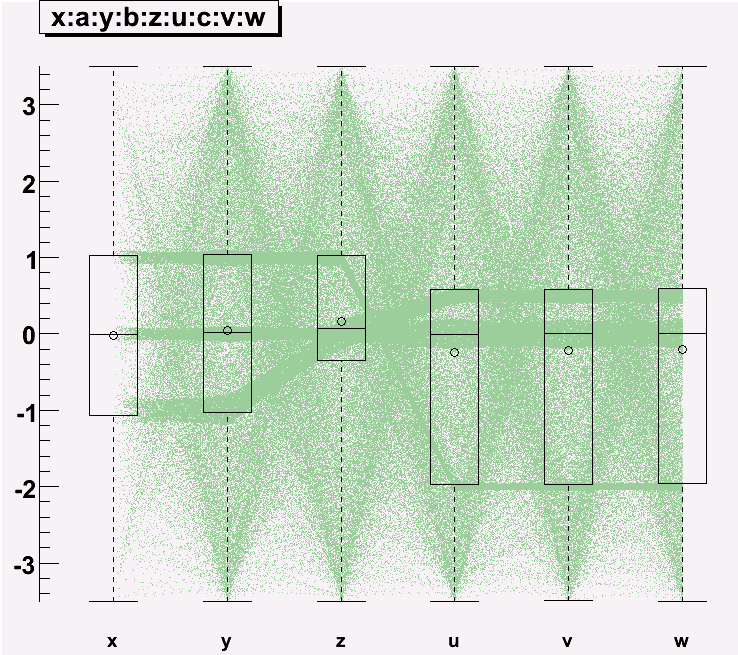
The "N variables" visualization techniques are used to display Trees and Ntuples.
 |
Above 4 variables more specific visualization techniques are required; ROOT provides three of them. The parallel coordinates (on the left) the candle plots (onthe right) which can be combined with the parallel coordinates. And the spider plot. These three techniques, and in particular the parallel coordinates, require a high level of interactivity to be fully efficient. |  |
