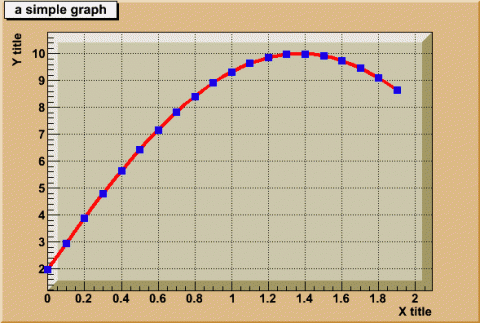
The "2 variables" visualization techniques are used to display Trees, Ntuples, 1D histograms, functions y=f(x) and graphs.
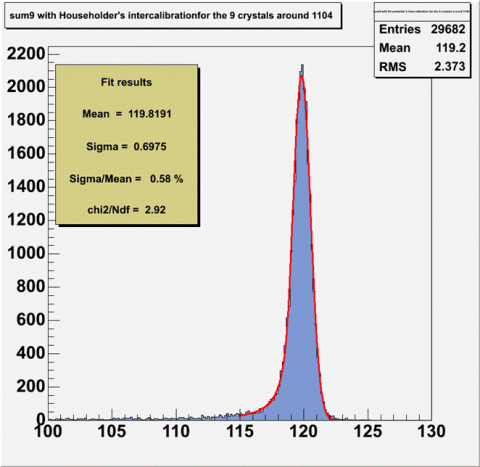
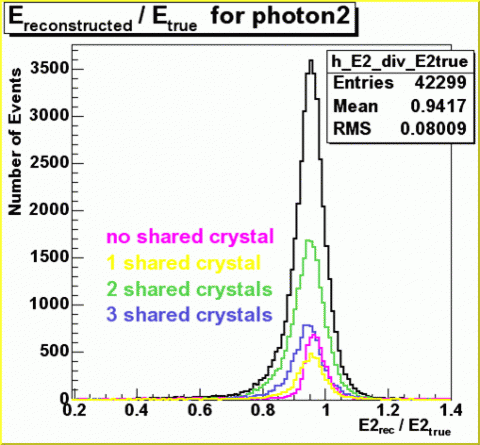
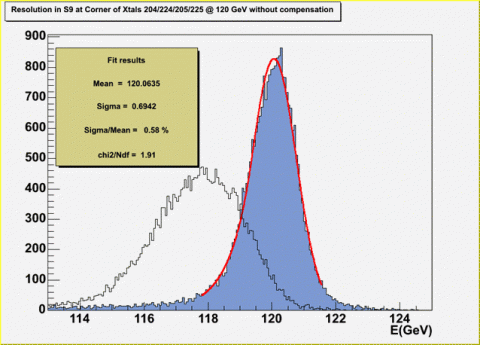
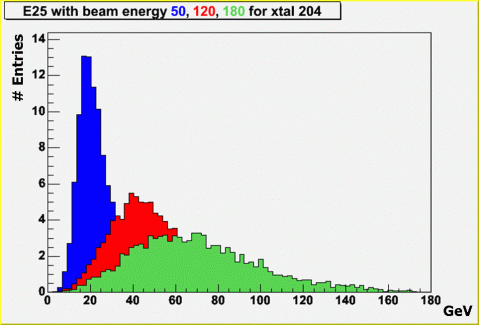
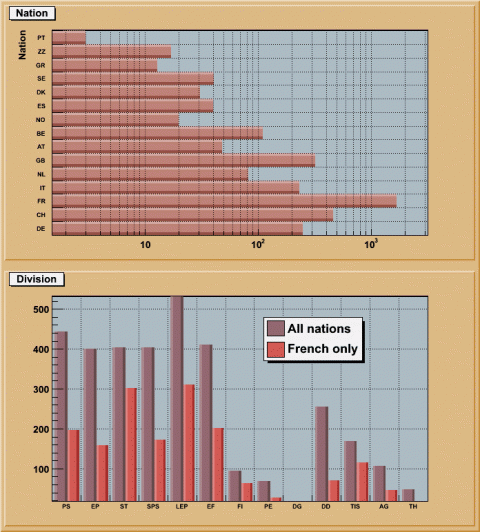
- Bar charts and lines are a common way to represent 1D histograms
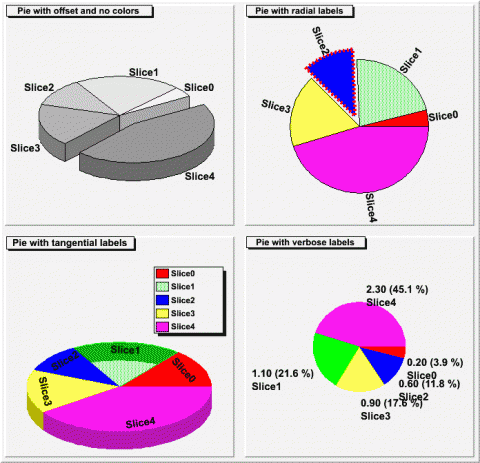
- Pie charts can be used to visualize 1D histograms. They also can be created from a simple mono dimensional vector.
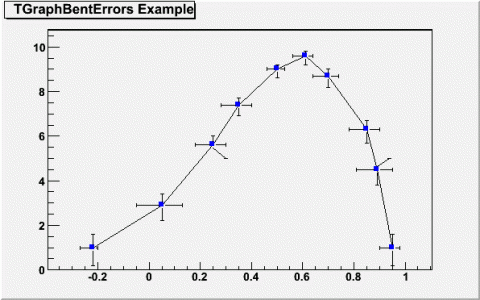
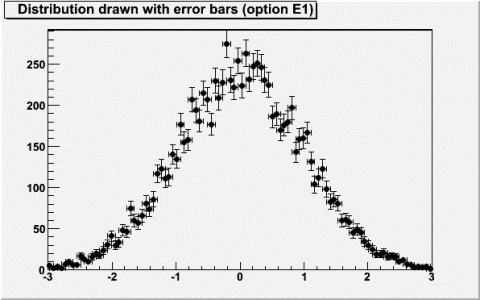
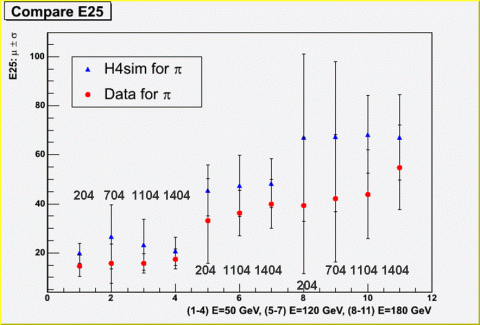
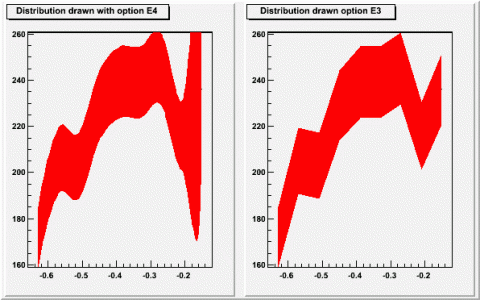
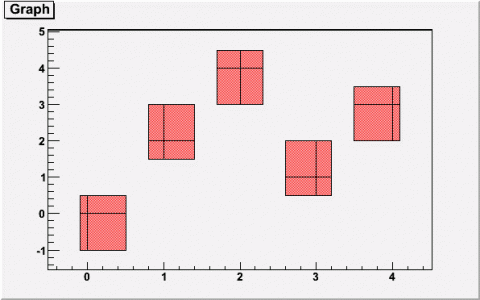
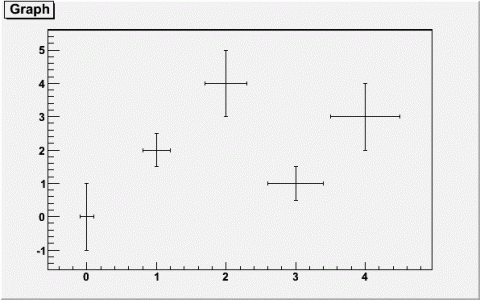
- Errors can be represented as bars, band, rectangles. They can be symmetric, asymmetric or bent. 1D histograms and graphs can be drawn that way.
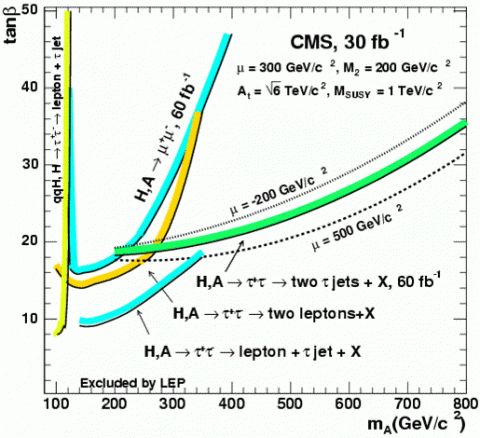
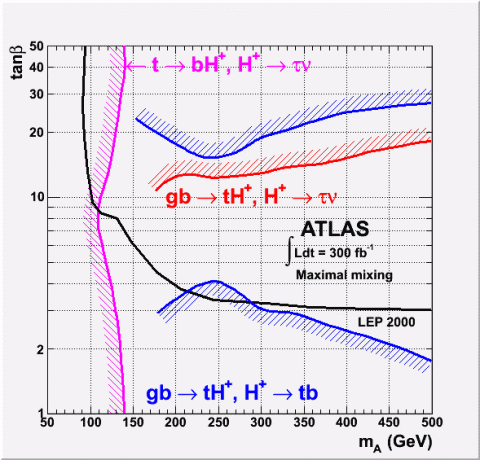
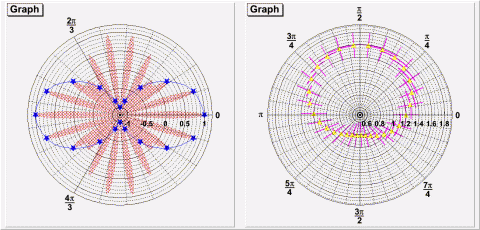
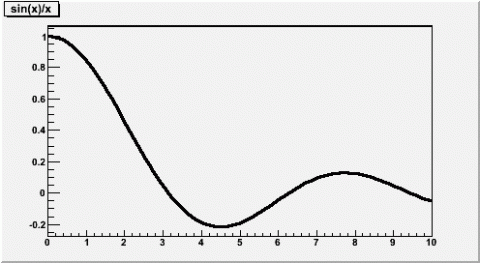
- Graphs can be drawn as simple lines, like functions. They can also visualize exclusion zones or be plotted in polar coordinates.

