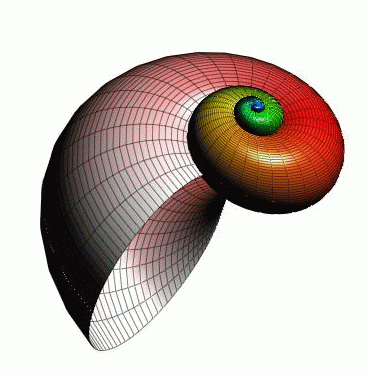
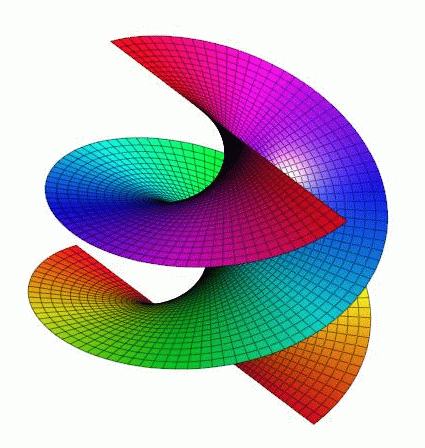
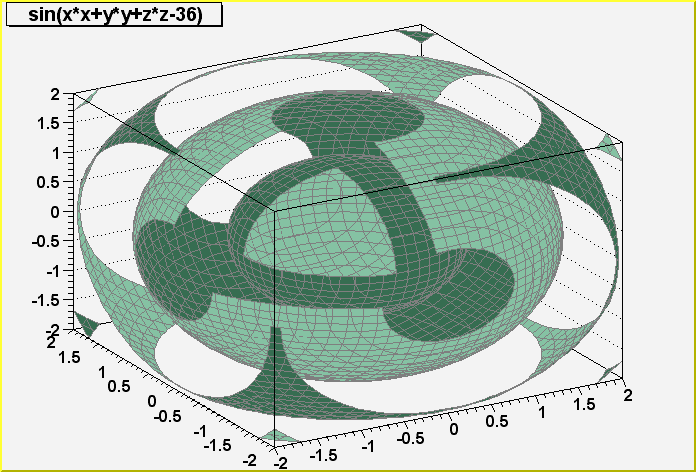
The "4 variables" visualization techniques are used to display Trees, Ntuples, 3D histograms and functions t = f(x,y,z).
 |
 /td> /td>
|  |
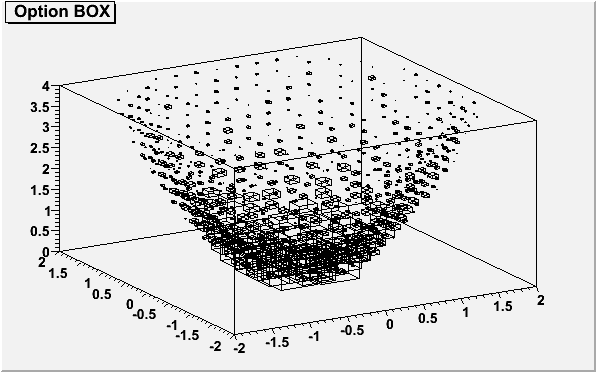 |
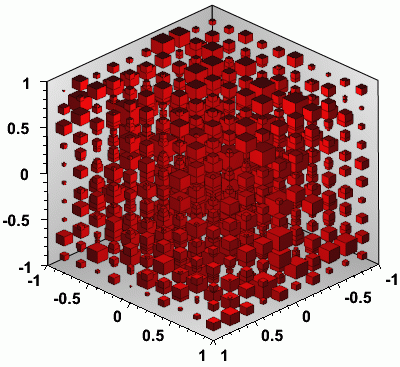
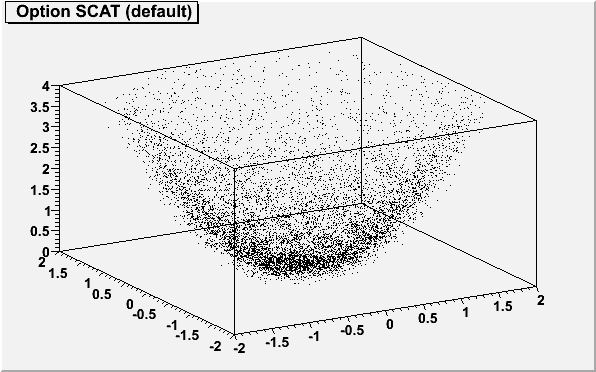
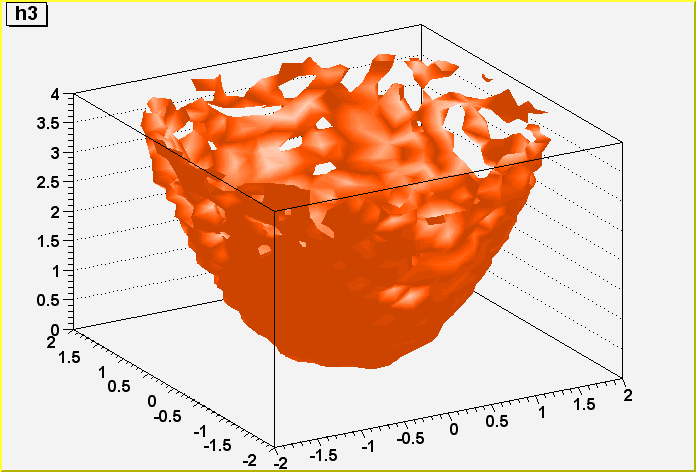
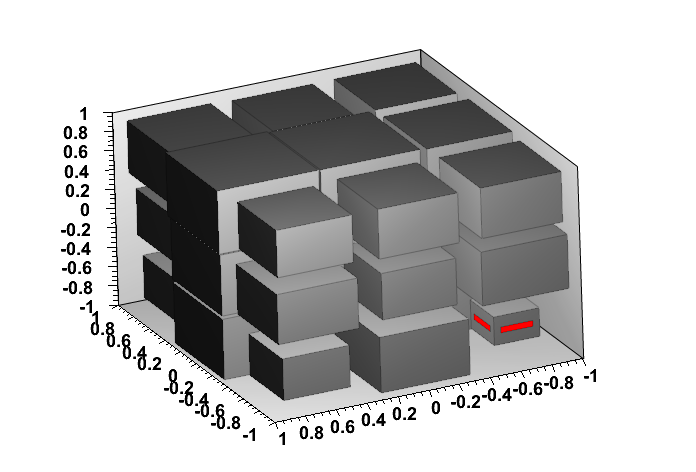
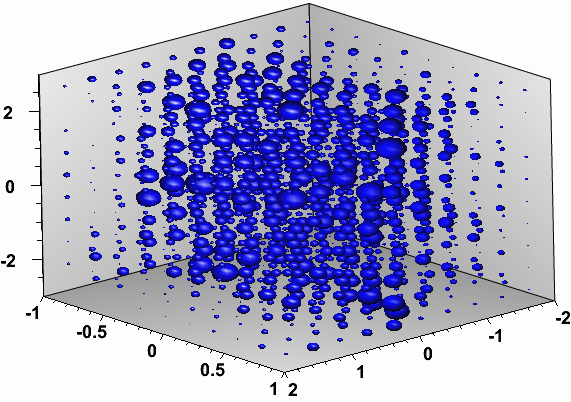
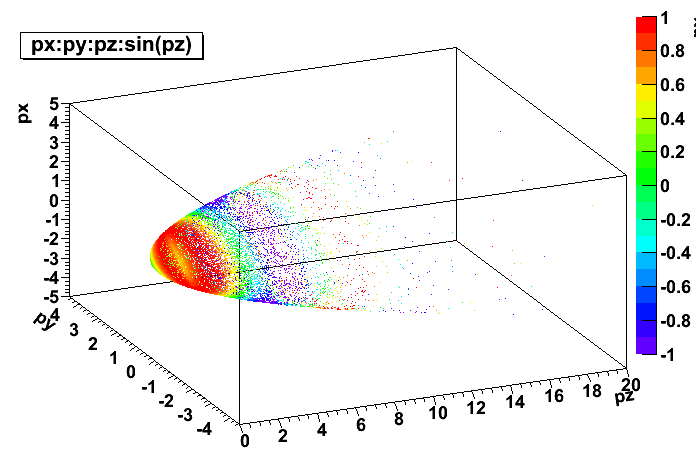
The 4 variables data set representations are extrapolations of the 3 variables ones. Rectangles become boxes or spheres, contour plots become iso-surfaces. The scatter plots (density plots) are drawn in boxes instead of rectangles. The 4th variable can also be mapped on colors. The use of OpenGL allows to enhance the plots’ quality and the interactivity. | |
 |
 |
 |
 |
 |
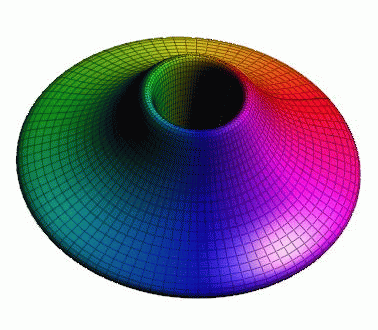
Functions like t= f(x,y,z) and 3D histograms are 4 variables objects. ROOT can render using OpenGL. It allows to enhance the plots’ quality and the interactivity. Cutting planes, projection and zoom allow to better understand the data set or function. |
 |
 |
