
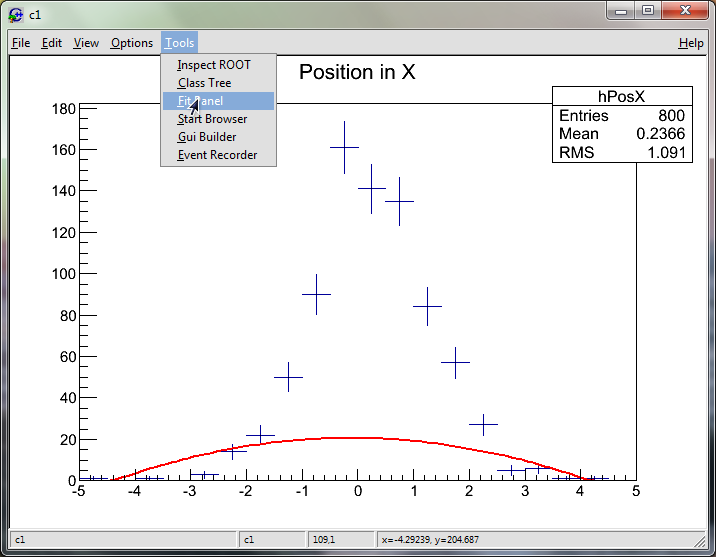
As you can see, the fit (solid line) doesn't really describe the data: a polynomial is nowhere close to most data points. So from the Canvas, start the fit panel and use a gaussian ("gaus") instead of a "pol2" to perform the fit. (You don't know what a Gaussian is? see http://en.wikipedia.org/wiki/Gaussian_function)
Here is what the fit panel looks like:
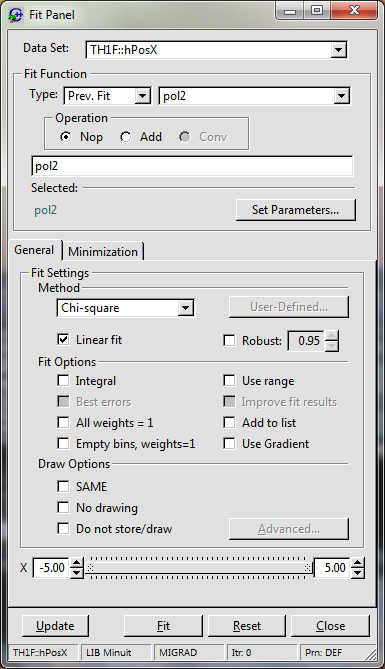
Using this fit panel allows you to change the fit function and see the result after pressing "Fit". Now you should see the difference:
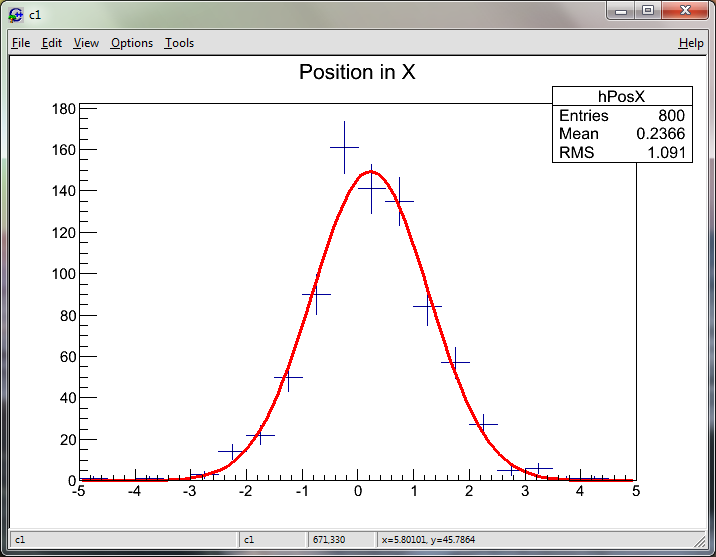
The solid line is now passing through every data point. It fits (almost) perfectly the data!