
Now, with the TFile still open, let's do some interactive work. Start the ROOT Browser by typing:
root[1] new TBrowser()
Something like this should appear:
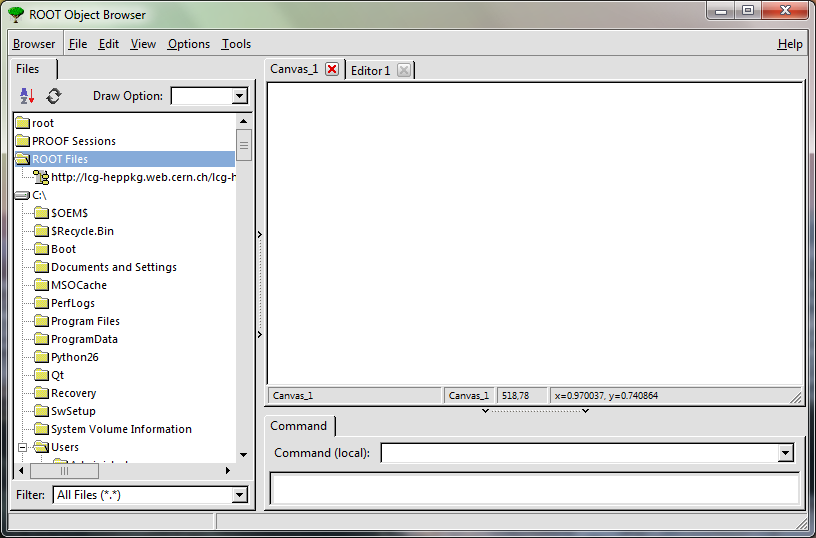
On the left, in the "ROOT Files" folder, you can find the ROOT file you have opened and our EventTree. If you see EventTree;1 and EventTree: they are identical. The first one is the tree on disk, the second the one in memory. Click your way through the tree.
Draw the "fPosZ" values from the browser. You should obtain a result looking like this:
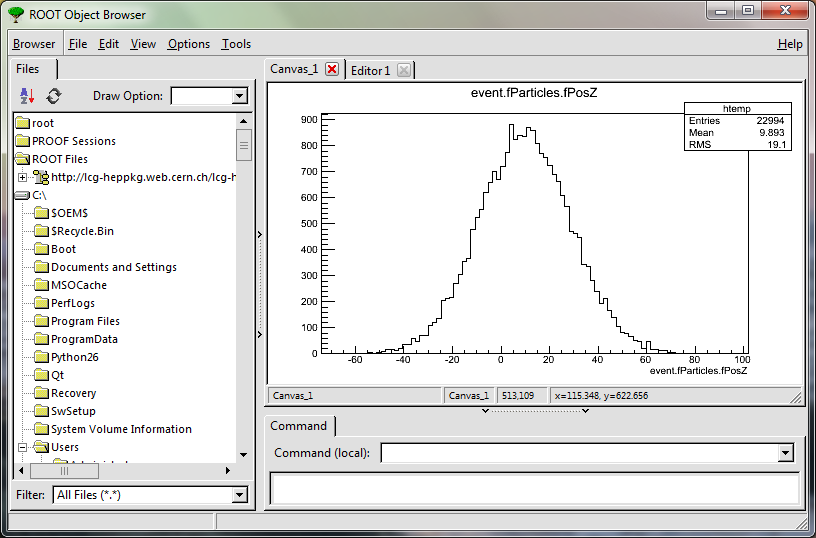
This graph is called a histogram: it counts occurrences, combining neighboring values into "bins". In this case we have 100 equally sized bins (the "steps"), ranging from x=-74 to x=102. You can tell that there were about 500 particles with a fPosZ value around -11. Histograms are a very common way to visualize data, e.g. in high energy physics.
Now close the browser, quit and restart ROOT (to make sure everybody starts from the same point).