Loading [MathJax]/jax/output/HTML-CSS/config.js
Logo ROOT   6.12/07
Reference Guide
All Classes Namespaces Files Functions Variables Typedefs Enumerations Enumerator Properties Friends Macros Modules Pages
vectorizedFit.C File Reference

Detailed Description

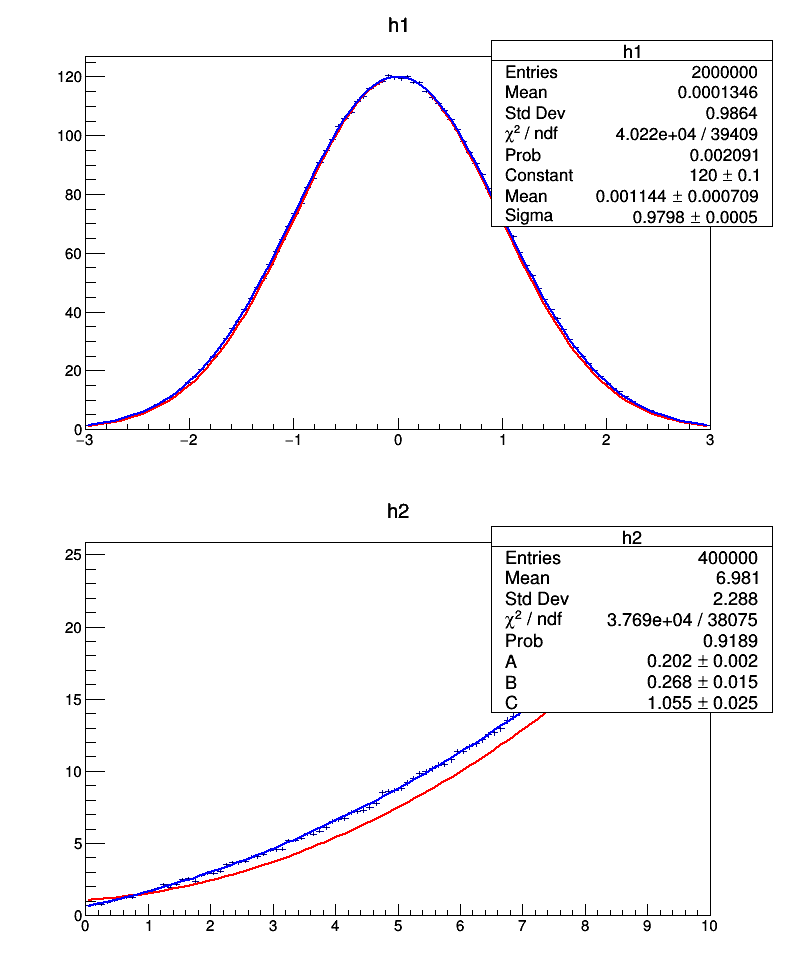
View in nbviewer Open in SWAN use it for fitting an histogram

To create a vectorized function (if ROOT has been compiled with support for vectorization) is very easy. One needs to create the TF1 object with the option "VEC" or call the method TF1::SetVectorized

pict1_vectorizedFit.C.png

output

void vectorizedFit() {
gStyle->SetOptFit(111111);
int nbins = 40000;
auto h1 = new TH1D("h1","h1",nbins,-3,3);
h1->FillRandom("gaus",nbins*50);
auto c1 = new TCanvas("Fit","Fit",800,1000);
c1->Divide(1,2);
c1->cd(1);
std::cout << "Doing Serial Gaussian Fit " << std::endl;
auto f1 = new TF1("f1","gaus");
f1->SetNpx(nbins*10);
w.Start();
h1->Fit(f1);
h1->Fit(f1,"L+");
w.Print();
std::cout << "Doing Vectorized Gaussian Fit " << std::endl;
auto f2 = new TF1("f2","gaus",-3,3,"VEC");
// alternativly you can also use the TF1::SetVectorized function
//f2->SetVectorized(true);
w.Start();
h1->Fit(f2);
h1->Fit(f2,"L+");
w.Print();
// rebin histograms and scale it back to the function
h1->Rebin(nbins/100);
h1->Scale(100./nbins);
((TF1 *)h1->GetListOfFunctions()->At(0))->SetTitle("Chi2 Fit");
((TF1 *)h1->GetListOfFunctions()->At(1))->SetTitle("Likelihood Fit");
((TF1 *)h1->GetListOfFunctions()->At(1))->SetLineColor(kBlue);
//c1->cd(1)->BuildLegend();
/// Do a polynomail fit now
c1->cd(2);
auto f3 = new TF1("f3","[A]*x^2+[B]*x+[C]",0,10);
f3->SetParameters(0.5,3,2);
f3->SetNpx(nbins*10);
// generate the events
auto h2 = new TH1D("h2","h2",nbins,0,10);
h2->FillRandom("f3",10*nbins);
std::cout << "Doing Serial Polynomial Fit " << std::endl;
f3->SetParameters(2,2,2);
w.Start();
h2->Fit(f3);
h2->Fit(f3,"L+");
w.Print();
std::cout << "Doing Vectorized Polynomial Fit " << std::endl;
auto f4 = new TF1("f4","[A]*x*x+[B]*x+[C]",0,10);
f4->SetVectorized(true);
f4->SetParameters(2,2,2);
w.Start();
h2->Fit(f4);
h2->Fit(f4,"L+");
w.Print();
// rebin histograms and scale it back to the function
h2->Rebin(nbins/100);
h2->Scale(100./nbins);
((TF1 *)h2->GetListOfFunctions()->At(0))->SetTitle("Chi2 Fit");
((TF1 *)h2->GetListOfFunctions()->At(1))->SetTitle("Likelihood Fit");
((TF1 *)h2->GetListOfFunctions()->At(1))->SetLineColor(kBlue);
//c1->cd(2)->BuildLegend();
}
Author
Lorenzo Moneta

Definition in file vectorizedFit.C.