ROOT  6.07/01
Reference Guide
 All Classes Namespaces Files Functions Variables Typedefs Enumerations Enumerator Properties Friends Macros Groups Pages
gerrors2.C File Reference

Draw two graphs with error bars. More...

Go to the source code of this file.

Detailed Description

Draw two graphs with error bars.

pict1_gerrors2.C.png
void gerrors2() {
TCanvas *c1 = new TCanvas("c1","gerrors2",200,10,700,500);
c1->SetFillColor(42);
c1->SetGrid();
// draw a frame to define the range
TH1F *hr = c1->DrawFrame(-0.4,0,1.2,12);
hr->SetXTitle("X title");
hr->SetYTitle("Y title");
c1->GetFrame()->SetFillColor(21);
c1->GetFrame()->SetBorderSize(12);
// create first graph
const Int_t n1 = 10;
Double_t x1[] = {-0.22, 0.05, 0.25, 0.35, 0.5, 0.61,0.7,0.85,0.89,0.95};
Double_t y1[] = {1,2.9,5.6,7.4,9,9.6,8.7,6.3,4.5,1};
Double_t ex1[] = {.05,.1,.07,.07,.04,.05,.06,.07,.08,.05};
Double_t ey1[] = {.8,.7,.6,.5,.4,.4,.5,.6,.7,.8};
TGraphErrors *gr1 = new TGraphErrors(n1,x1,y1,ex1,ey1);
gr1->SetMarkerStyle(21);
gr1->Draw("LP");
// create second graph
const Int_t n2 = 10;
Float_t x2[] = {-0.28, 0.005, 0.19, 0.29, 0.45, 0.56,0.65,0.80,0.90,1.01};
Float_t y2[] = {0.82,3.86,7,9,10,10.55,9.64,7.26,5.42,2};
Float_t ex2[] = {.04,.12,.08,.06,.05,.04,.07,.06,.08,.04};
Float_t ey2[] = {.6,.8,.7,.4,.3,.3,.4,.5,.6,.7};
TGraphErrors *gr2 = new TGraphErrors(n2,x2,y2,ex2,ey2);
gr2->SetMarkerStyle(20);
gr2->Draw("LP");
}
Author
Rene Brun

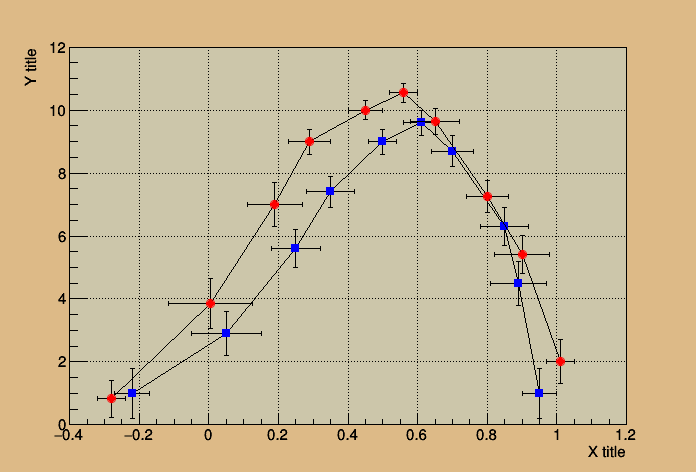
Definition in file gerrors2.C.