Loading [MathJax]/extensions/tex2jax.js
Logo ROOT   6.12/07
Reference Guide
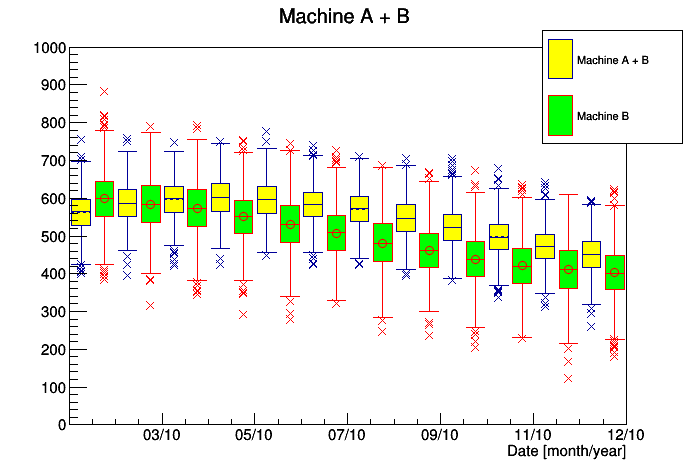
All Classes Namespaces Files Functions Variables Typedefs Enumerations Enumerator Properties Friends Macros Modules Pages
candleplot.C File Reference

Detailed Description

View in nbviewer Open in SWAN Example of candle plot with 2-D histograms.

pict1_candleplot.C.png
void candleplot() {
TRandom *rand = new TRandom();
TDatime *dateBegin = new TDatime(2010,1,1,0,0,0);
TDatime *dateEnd = new TDatime(2011,1,1,0,0,0);
TH2I *h1 = new TH2I("h1","Machine A + B",12,dateBegin->Convert(),dateEnd->Convert(),1000,0,1000);
TH2I *h2 = new TH2I("h2","Machine B",12,dateBegin->Convert(),dateEnd->Convert(),1000,0,1000);
h1->GetXaxis()->SetTimeFormat("%m/%y");
h1->GetXaxis()->SetTitle("Date [month/year]");
float Rand;
for (int i = dateBegin->Convert(); i < dateEnd->Convert(); i+=86400*30) {
for (int j = 0; j < 1000; j++) {
Rand = rand->Gaus(500+sin(i/10000000.)*100,50); h1->Fill(i,Rand);
Rand = rand->Gaus(500+sin(i/11000000.)*100,70); h2->Fill(i,Rand);
}
}
h1->SetBarWidth(0.4);
h1->SetBarOffset(-0.25);
h1->SetFillColor(kYellow);
h1->SetFillStyle(1001);
h2->SetBarWidth(0.4);
h2->SetBarOffset(0.25);
h2->SetLineColor(kRed);
h2->SetFillColor(kGreen);
TCanvas *c1 = new TCanvas();
h1->Draw("candle2");
h2->Draw("candle3 same");
gPad->BuildLegend(0.78,0.695,0.980,0.935,"","f");
}
Author
Georg Troska

Definition in file candleplot.C.