This tutorial shows a more complex example using the FeldmanCousins utility to create a confidence interval for a toy neutrino oscillation experiment. The example attempts to faithfully reproduce the toy example described in Feldman & Cousins' original paper, Phys.Rev.D57:3873-3889,1998.
[#1] INFO:InputArguments -- Silent clipping of values to range in `RooRealVar::setVal()` enabled.
[#1] INFO:NumericIntegration -- RooRealIntegral::init(PnmuTone_Int[L]) using numeric integrator RooIntegrator1D to calculate Int(L)
generate toy data with nEvents = 692
Minuit2Minimizer: Minimize with max-calls 1000 convergence for edm < 1 strategy 1
Minuit2Minimizer : Valid minimum - status = 0
FVAL = -1143.51305519945186
Edm = 2.62634026095380493e-06
Nfcn = 85
deltaMSq = 1.00008 +/- 20.6319 (limited)
sinSq2theta = 0.02 +/- 0.000213424 (limited)
[#1] INFO:Minimization -- p.d.f. provides expected number of events, including extended term in likelihood.
[#1] INFO:Fitting -- RooAbsPdf::fitTo(model) fixing normalization set for coefficient determination to observables in data
[#1] INFO:Fitting -- using generic CPU library compiled with no vectorizations
[#1] INFO:Fitting -- Creation of NLL object took 396.842 μs
Metropolis-Hastings progress: ....................................................................................................
[#1] INFO:Eval -- Proposal acceptance rate: 0.4%
[#1] INFO:Eval -- Number of steps in chain: 20
[#0] ERROR:InputArguments -- MCMCInterval::CreateKeysPdf: creation of Keys PDF failed: Number of burn-in steps (num steps to ignore) >= number of steps in Markov chain.
[#0] WARNING:NumericIntegration -- RooAdaptiveIntegratorND::dtor(PnmuTone) WARNING: Number of suppressed warningings about integral evaluations where target precision was not reached is 633
Real time 0:00:35, CP time 35.580
MCMC actual confidence level: 0
[#0] ERROR:InputArguments -- MCMCInterval::CreateKeysPdf: creation of Keys PDF failed: Number of burn-in steps (num steps to ignore) >= number of steps in Markov chain.
[#0] ERROR:InputArguments -- MCMCIntervalPlot::DrawKeysPdfInterval: Couldn't get posterior Keys PDF.
[#1] INFO:Minimization -- RooProfileLL::evaluate(RooEvaluatorWrapper_Profile[deltaMSq,sinSq2theta]) Creating instance of MINUIT
[#1] INFO:Fitting -- RooAddition::defaultErrorLevel(nll_model_modelData) Summation contains a RooNLLVar, using its error level
[#1] INFO:Minimization -- RooProfileLL::evaluate(RooEvaluatorWrapper_Profile[deltaMSq,sinSq2theta]) determining minimum likelihood for current configurations w.r.t all observable
[#1] INFO:Minimization -- [fitFCN] No discrete parameters, performing continuous minimization only
[#1] INFO:Minimization -- RooProfileLL::evaluate(RooEvaluatorWrapper_Profile[deltaMSq,sinSq2theta]) minimum found at (deltaMSq=1, sinSq2theta=0.02)
.[#1] INFO:Minimization -- [fitFCN] No discrete parameters, performing continuous minimization only
.[#1] INFO:Minimization -- [fitFCN] No discrete parameters, performing continuous minimization only
[#1] INFO:Minimization -- LikelihoodInterval - Finding the contour of deltaMSq ( 0 ) and sinSq2theta ( 1 )
Real time 0:01:03, CP time 63.800
#include <iostream>
{
cout <<
"generate toy data with nEvents = " <<
nEventsData << endl;
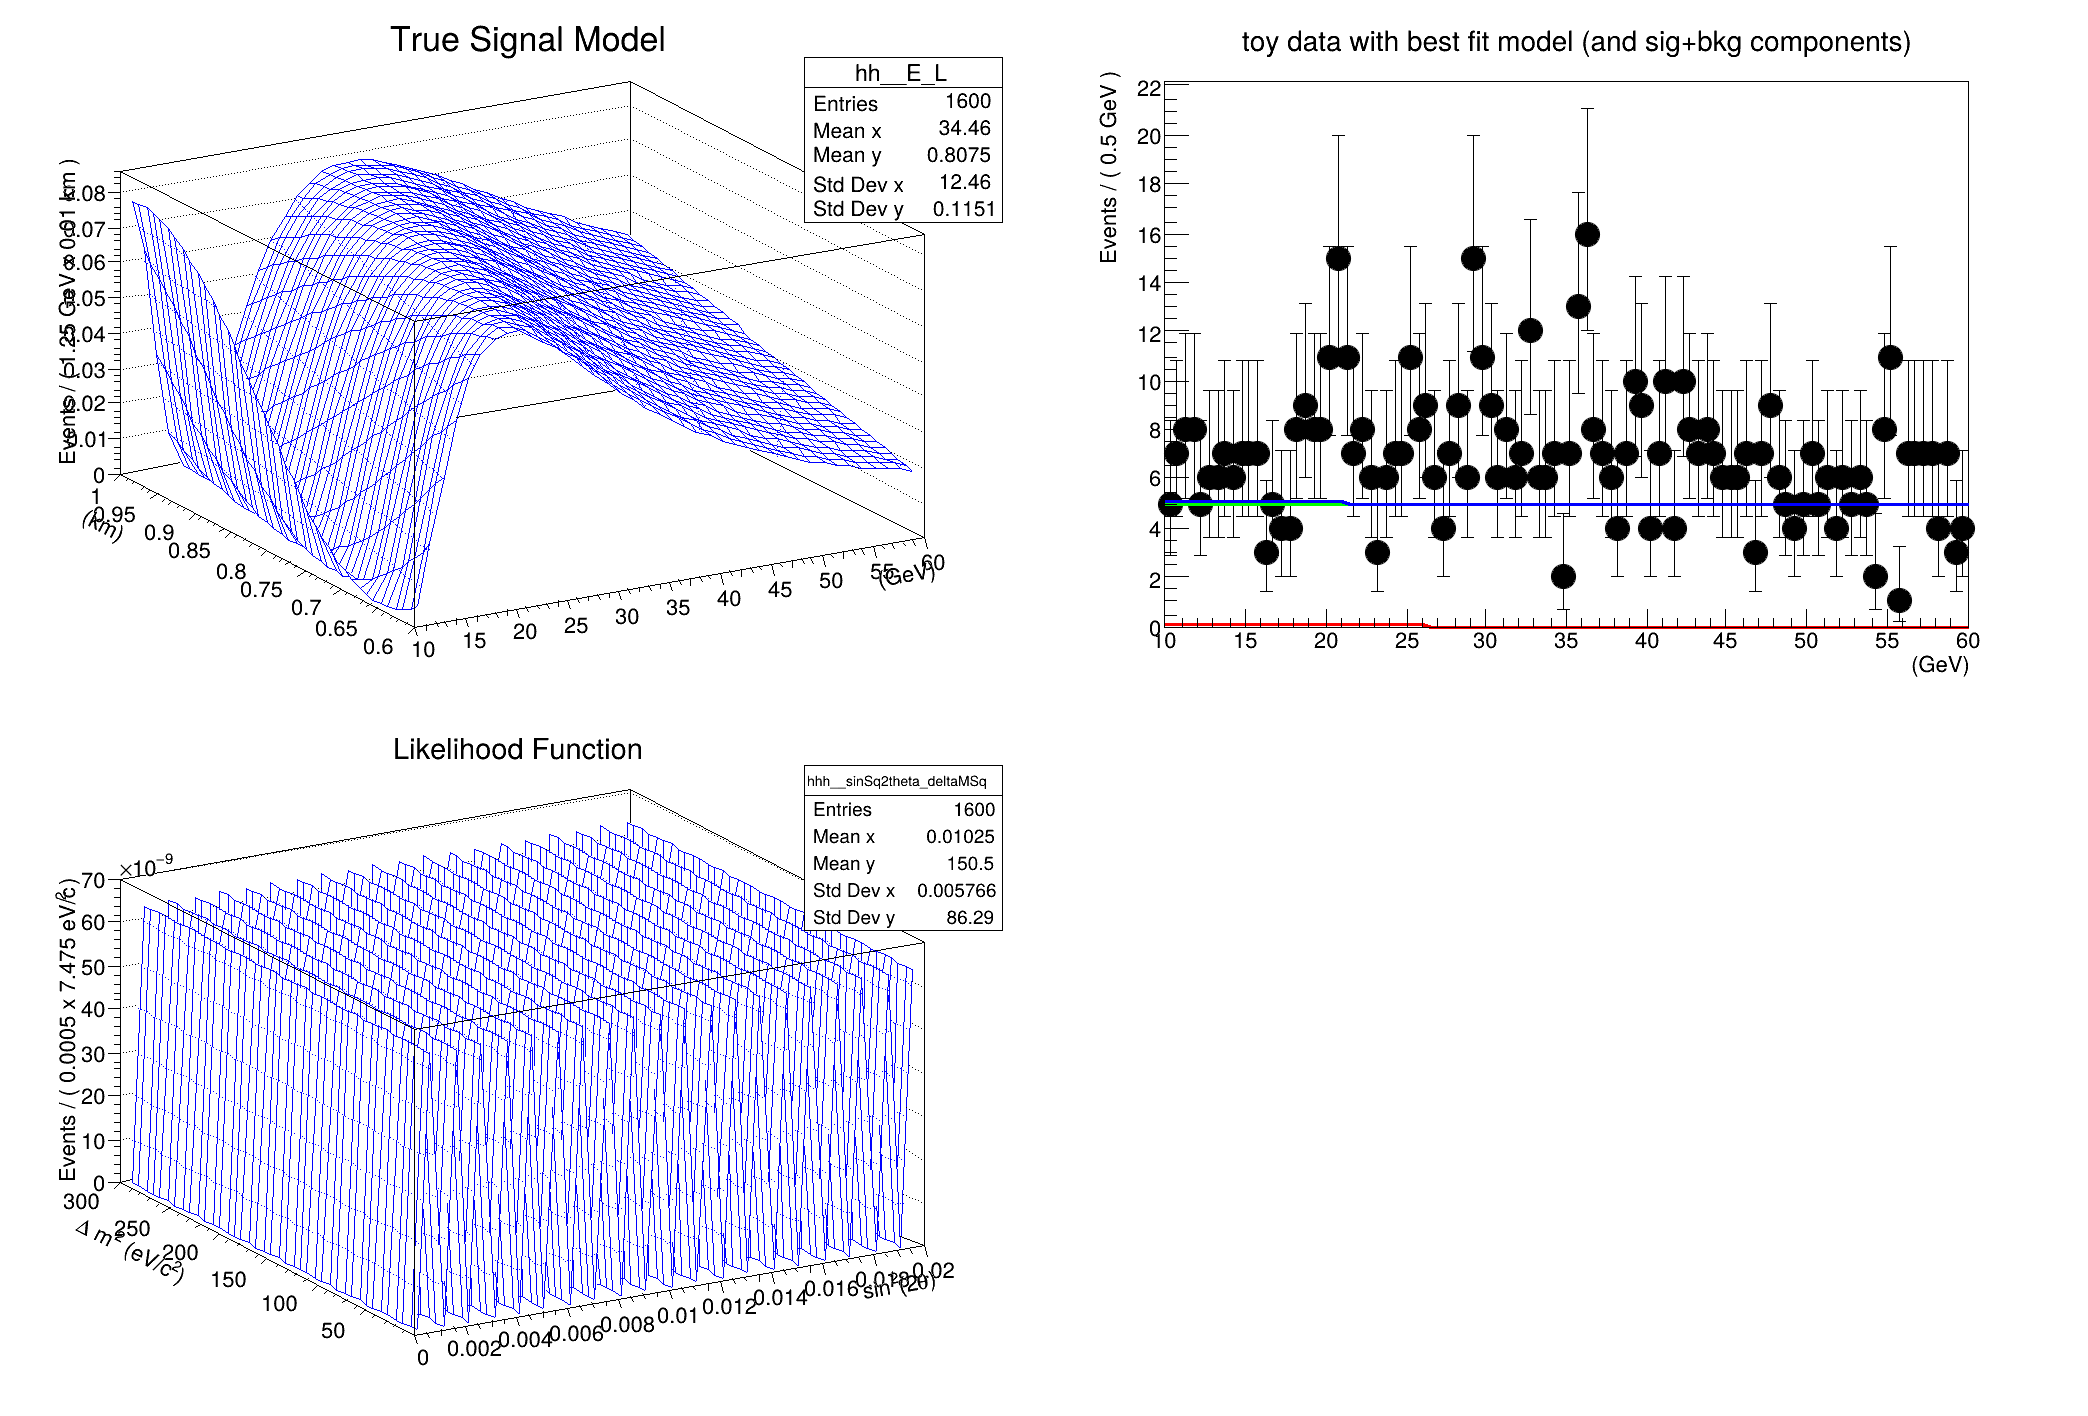
hh->SetTitle(
"True Signal Model");
model.fitTo(*
data, Extended());
Eframe->SetTitle(
"toy data with best fit model (and sig+bkg components)");
std::unique_ptr<RooAbsReal>
nll{model.createNLL(*
data, Extended(
true))};
hhh->SetTitle(
"Likelihood Function");
fc.UseAdaptiveSampling(
true);
mc.SetNumBurnInSteps(100);
}
} else {
}
}
}
}
}
cout <<
"MCMC actual confidence level: " <<
mcInt->GetActualConfidenceLevel() << endl;
}
plotInt.SetTitle(
"90% Confidence Intervals");
else
}
int Int_t
Signed integer 4 bytes (int)
double Double_t
Double 8 bytes.
ROOT::Detail::TRangeCast< T, true > TRangeDynCast
TRangeDynCast is an adapter class that allows the typed iteration through a TCollection.
Option_t Option_t TPoint TPoint const char GetTextMagnitude GetFillStyle GetLineColor GetLineWidth GetMarkerStyle GetTextAlign GetTextColor GetTextSize void data
Abstract interface for all probability density functions.
Abstract base class for objects that represent a real value and implements functionality common to al...
Efficient implementation of a sum of PDFs of the form.
RooArgList is a container object that can hold multiple RooAbsArg objects.
RooArgSet is a container object that can hold multiple RooAbsArg objects.
Represents a constant real-valued object.
Container class to hold N-dimensional binned data.
Container class to hold unbinned data.
Implementation of a probability density function that takes a RooArgList of servers and a C++ express...
static RooMsgService & instance()
Return reference to singleton instance.
Plot frame and a container for graphics objects within that frame.
RooPolynomial implements a polynomial p.d.f of the form.
Represents the product of a given set of RooAbsReal objects.
Implements the profile likelihood estimator for a given likelihood and set of parameters of interest.
static TRandom * randomGenerator()
Return a pointer to a singleton random-number generator implementation.
Variable that can be changed from the outside.
static void enableSilentClipping(bool flag=true)
Enable or disable the silent clipping behavior of RooRealVar::setVal() that was the default in ROOT v...
ConfInterval is an interface class for a generic interval in the RooStats framework.
The FeldmanCousins class (like the Feldman-Cousins technique) is essentially a specific configuration...
This class provides simple and straightforward utilities to plot a LikelihoodInterval object.
LikelihoodInterval is a concrete implementation of the RooStats::ConfInterval interface.
Bayesian Calculator estimating an interval or a credible region using the Markov-Chain Monte Carlo me...
This class provides simple and straightforward utilities to plot a MCMCInterval object.
MCMCInterval is a concrete implementation of the RooStats::ConfInterval interface.
< A class that holds configuration information for a model using a workspace as a store
The ProfileLikelihoodCalculator is a concrete implementation of CombinedCalculator (the interface cla...
Persistable container for RooFit projects.
TH1 is the base class of all histogram classes in ROOT.
virtual Int_t FindBin(Double_t x, Double_t y=0, Double_t z=0)
Return Global bin number corresponding to x,y,z.
TObject * Clone(const char *newname="") const override
Make a complete copy of the underlying object.
2-D histogram with a float per channel (see TH1 documentation)
void Start(Bool_t reset=kTRUE)
Start the stopwatch.
void Stop()
Stop the stopwatch.
void Print(Option_t *option="") const override
Print the real and cpu time passed between the start and stop events.
RooCmdArg YVar(const RooAbsRealLValue &var, const RooCmdArg &arg={})
RooCmdArg Scaling(bool flag)
RooCmdArg Components(Args_t &&... argsOrArgSet)
RooCmdArg Binning(const RooAbsBinning &binning)
RooCmdArg LineColor(TColorNumber color)
double nll(double pdf, double weight, int binnedL, int doBinOffset)
The namespace RooFit contains mostly switches that change the behaviour of functions of PDFs (or othe...
Namespace for the RooStats classes.
constexpr Double_t E()
Base of natural log: .