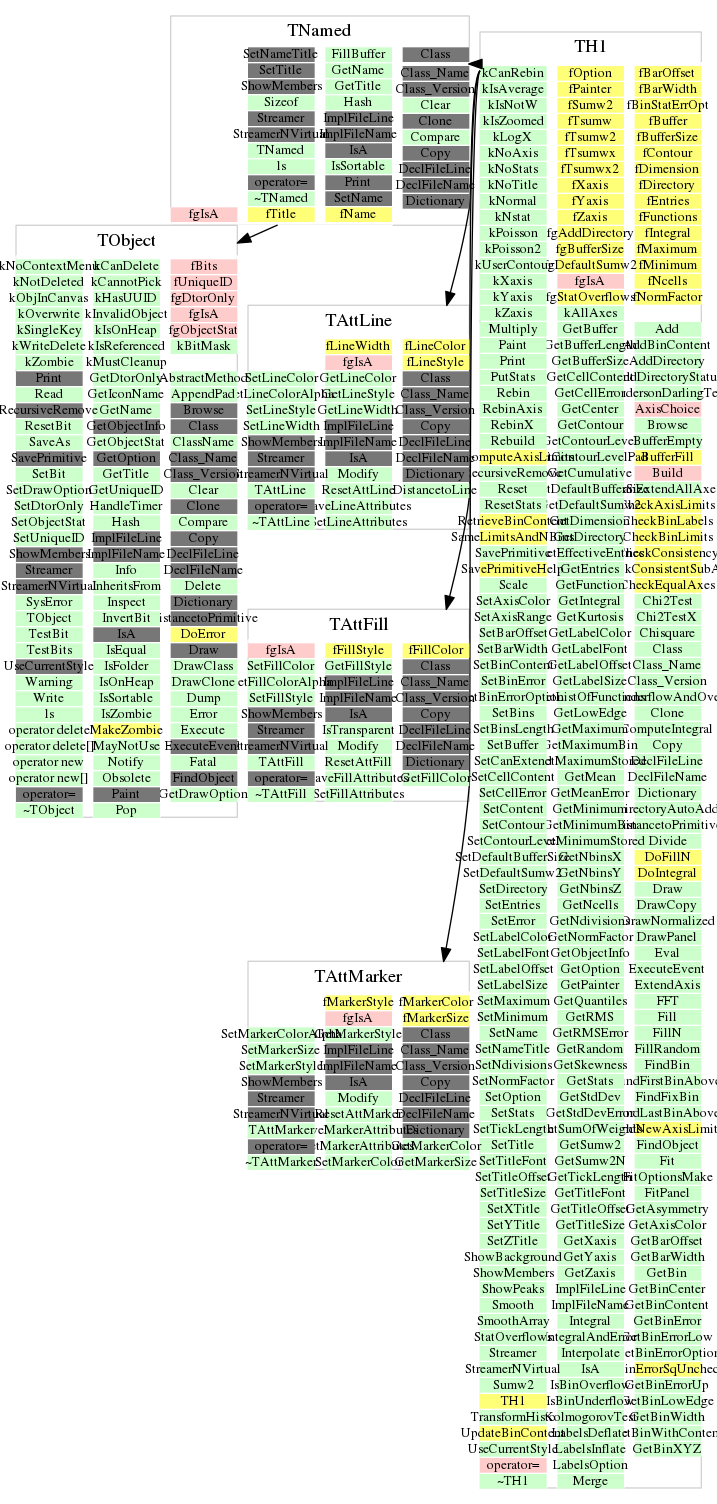
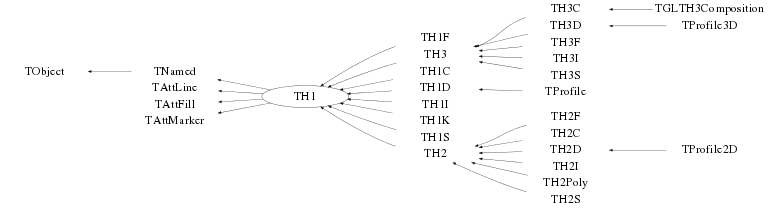
class TH1: public TNamed, public TAttLine, public TAttFill, public TAttMarker
The Histogram classes
- 1-D histograms:
- TH1C : histograms with one byte per channel. Maximum bin content = 127
- TH1S : histograms with one short per channel. Maximum bin content = 32767
- TH1I : histograms with one int per channel. Maximum bin content = 2147483647
- TH1F : histograms with one float per channel. Maximum precision 7 digits
- TH1D : histograms with one double per channel. Maximum precision 14 digits
- 2-D histograms:
- TH2C : histograms with one byte per channel. Maximum bin content = 127
- TH2S : histograms with one short per channel. Maximum bin content = 32767
- TH2I : histograms with one int per channel. Maximum bin content = 2147483647
- TH2F : histograms with one float per channel. Maximum precision 7 digits
- TH2D : histograms with one double per channel. Maximum precision 14 digits
- 3-D histograms:
- TH3C : histograms with one byte per channel. Maximum bin content = 127
- TH3S : histograms with one short per channel. Maximum bin content = 32767
- TH3I : histograms with one int per channel. Maximum bin content = 2147483647
- TH3F : histograms with one float per channel. Maximum precision 7 digits
- TH3D : histograms with one double per channel. Maximum precision 14 digits
- Profile histograms: See classes TProfile, TProfile2D and TProfile3D. Profile histograms are used to display the mean value of Y and its RMS for each bin in X. Profile histograms are in many cases an elegant replacement of two-dimensional histograms : the inter-relation of two measured quantities X and Y can always be visualized by a two-dimensional histogram or scatter-plot; If Y is an unknown (but single-valued) approximate function of X, this function is displayed by a profile histogram with much better precision than by a scatter-plot.
                                TH1
                                 ^
                                 |
                                 |
                                 |
         -----------------------------------------------------------
                |                |       |      |      |     |     |
                |                |      TH1C   TH1S   TH1I  TH1F  TH1D
                |                |                                 |
                |                |                                 |
                |               TH2                             TProfile
                |                |
                |                |
                |                ----------------------------------
                |                        |      |      |     |     |
                |                       TH2C   TH2S   TH2I  TH2F  TH2D
                |                                                  |
               TH3                                                 |
                |                                               TProfile2D
                |
                -------------------------------------
                        |      |      |      |      |
                       TH3C   TH3S   TH3I   TH3F   TH3D
                                                    |
                                                    |
                                                 TProfile3D
      The TH*C classes also inherit from the array class TArrayC.
      The TH*S classes also inherit from the array class TArrayS.
      The TH*I classes also inherit from the array class TArrayI.
      The TH*F classes also inherit from the array class TArrayF.
      The TH*D classes also inherit from the array class TArrayD.
Creating histograms
Histograms are created by invoking one of the constructors, e.g.
       TH1F *h1 = new TH1F("h1", "h1 title", 100, 0, 4.4);
       TH2F *h2 = new TH2F("h2", "h2 title", 40, 0, 4, 30, -3, 3);
Histograms may also be created by:
- calling the Clone function, see below
- making a projection from a 2-D or 3-D histogram, see below
- reading an histogram from a file
When an histogram is created, a reference to it is automatically added to the list of in-memory objects for the current file or directory. This default behaviour can be changed by:
       h->SetDirectory(0);          for the current histogram h
       TH1::AddDirectory(kFALSE);   sets a global switch disabling the reference
When the histogram is deleted, the reference to it is removed from
the list of objects in memory.
When a file is closed, all histograms in memory associated with this file
are automatically deleted.
Fix or variable bin size
All histogram types support either fix or variable bin sizes. 2-D histograms may have fix size bins along X and variable size bins along Y or vice-versa. The functions to fill, manipulate, draw or access histograms are identical in both cases.Each histogram always contains 3 objects TAxis: fXaxis, fYaxis and fZaxis To access the axis parameters, do:
        TAxis *xaxis = h->GetXaxis(); etc.
        Double_t binCenter = xaxis->GetBinCenter(bin), etc.
See class TAxis for a description of all the access functions.
The axis range is always stored internally in double precision.
Convention for numbering bins
For all histogram types: nbins, xlow, xup
        bin = 0;       underflow bin
        bin = 1;       first bin with low-edge xlow INCLUDED
        bin = nbins;   last bin with upper-edge xup EXCLUDED
        bin = nbins+1; overflow bin
In case of 2-D or 3-D histograms, a "global bin" number is defined. For example, assuming a 3-D histogram with (binx, biny, binz), the function
Int_t gbin = h->GetBin(binx, biny, binz);
returns a global/linearized gbin number. This global gbin is useful
to access the bin content/error information independently of the dimension.
Note that to access the information other than bin content and errors
one should use the TAxis object directly with e.g.:
Double_t xcenter = h3->GetZaxis()->GetBinCenter(27);
returns the center along z of bin number 27 (not the global bin)
in the 3-D histogram h3.
Alphanumeric Bin Labels
By default, an histogram axis is drawn with its numeric bin labels. One can specify alphanumeric labels instead with:- call TAxis::SetBinLabel(bin, label); This can always be done before or after filling. When the histogram is drawn, bin labels will be automatically drawn. See example in $ROOTSYS/tutorials/graphs/labels1.C, labels2.C
- call to a Fill function with one of the arguments being a string, e.g.
           hist1->Fill(somename, weigth);
           hist2->Fill(x, somename, weight);
           hist2->Fill(somename, y, weight);
           hist2->Fill(somenamex, somenamey, weight);
See example in $ROOTSYS/tutorials/hist/hlabels1.C, hlabels2.C - via TTree::Draw.
see for example $ROOTSYS/tutorials/tree/cernstaff.C
tree.Draw("Nation::Division");where "Nation" and "Division" are two branches of a Tree.
When using the options 2 or 3 above, the labels are automatically added to the list (THashList) of labels for a given axis. By default, an axis is drawn with the order of bins corresponding to the filling sequence. It is possible to reorder the axis
- alphabetically
- by increasing or decreasing values
The reordering can be triggered via the TAxis context menu by selecting the menu item "LabelsOption" or by calling directly TH1::LabelsOption(option, axis) where
- axis may be "X", "Y" or "Z"
- option may be:
- "a" sort by alphabetic order
- ">" sort by decreasing values
- "<" sort by increasing values
- "h" draw labels horizontal
- "v" draw labels vertical
- "u" draw labels up (end of label right adjusted)
- "d" draw labels down (start of label left adjusted)
When using the option 2 above, new labels are added by doubling the current number of bins in case one label does not exist yet. When the Filling is terminated, it is possible to trim the number of bins to match the number of active labels by calling
TH1::LabelsDeflate(axis) with axis = "X", "Y" or "Z"
This operation is automatic when using TTree::Draw.
Once bin labels have been created, they become persistent if the histogram
is written to a file or when generating the C++ code via SavePrimitive.
Histograms with automatic bins
When an histogram is created with an axis lower limit greater or equal to its upper limit, the SetBuffer is automatically called with an argument fBufferSize equal to fgBufferSize (default value=1000). fgBufferSize may be reset via the static function TH1::SetDefaultBufferSize. The axis limits will be automatically computed when the buffer will be full or when the function BufferEmpty is called.Filling histograms
An histogram is typically filled with statements like:
       h1->Fill(x);
       h1->Fill(x, w); //fill with weight
       h2->Fill(x, y)
       h2->Fill(x, y, w)
       h3->Fill(x, y, z)
       h3->Fill(x, y, z, w)
or via one of the Fill functions accepting names described above.
The Fill functions compute the bin number corresponding to the given
x, y or z argument and increment this bin by the given weight.
The Fill functions return the bin number for 1-D histograms or global
bin number for 2-D and 3-D histograms.
If TH1::Sumw2 has been called before filling, the sum of squares of weights is also stored. One can also increment directly a bin number via TH1::AddBinContent or replace the existing content via TH1::SetBinContent. To access the bin content of a given bin, do:
Double_t binContent = h->GetBinContent(bin);
By default, the bin number is computed using the current axis ranges. If the automatic binning option has been set via
h->SetCanExtend(kAllAxes);
then, the Fill Function will automatically extend the axis range to
accomodate the new value specified in the Fill argument. The method
used is to double the bin size until the new value fits in the range,
merging bins two by two. This automatic binning options is extensively
used by the TTree::Draw function when histogramming Tree variables
with an unknown range.
This automatic binning option is supported for 1-D, 2-D and 3-D histograms. During filling, some statistics parameters are incremented to compute the mean value and Root Mean Square with the maximum precision.
In case of histograms of type TH1C, TH1S, TH2C, TH2S, TH3C, TH3S a check is made that the bin contents do not exceed the maximum positive capacity (127 or 32767). Histograms of all types may have positive or/and negative bin contents.
Rebinning
At any time, an histogram can be rebinned via TH1::Rebin. This function returns a new histogram with the rebinned contents. If bin errors were stored, they are recomputed during the rebinning.Associated errors
By default, for each bin, the sum of weights is computed at fill time. One can also call TH1::Sumw2 to force the storage and computation of the sum of the square of weights per bin. If Sumw2 has been called, the error per bin is computed as the sqrt(sum of squares of weights), otherwise the error is set equal to the sqrt(bin content). To return the error for a given bin number, do:
Double_t error = h->GetBinError(bin);
Associated functions
One or more object (typically a TF1*) can be added to the list of functions (fFunctions) associated to each histogram. When TH1::Fit is invoked, the fitted function is added to this list. Given an histogram h, one can retrieve an associated function with:
TF1 *myfunc = h->GetFunction("myfunc");
Operations on histograms
Many types of operations are supported on histograms or between histograms- Addition of an histogram to the current histogram.
- Additions of two histograms with coefficients and storage into the current histogram.
- Multiplications and Divisions are supported in the same way as additions.
- The Add, Divide and Multiply functions also exist to add, divide or multiply an histogram by a function.
Fitting histograms
Histograms (1-D, 2-D, 3-D and Profiles) can be fitted with a user specified function via TH1::Fit. When an histogram is fitted, the resulting function with its parameters is added to the list of functions of this histogram. If the histogram is made persistent, the list of associated functions is also persistent. Given a pointer (see above) to an associated function myfunc, one can retrieve the function/fit parameters with calls such as:
       Double_t chi2 = myfunc->GetChisquare();
       Double_t par0 = myfunc->GetParameter(0); value of 1st parameter
       Double_t err0 = myfunc->GetParError(0);  error on first parameter
Projections of histograms
One can:
- make a 1-D projection of a 2-D histogram or Profile see functions TH2::ProjectionX,Y, TH2::ProfileX,Y, TProfile::ProjectionX
- make a 1-D, 2-D or profile out of a 3-D histogram see functions TH3::ProjectionZ, TH3::Project3D.
One can fit these projections via:
TH2::FitSlicesX,Y, TH3::FitSlicesZ.
Random Numbers and histograms
TH1::FillRandom can be used to randomly fill an histogram using the contents of an existing TF1 function or another TH1 histogram (for all dimensions).For example the following two statements create and fill an histogram 10000 times with a default gaussian distribution of mean 0 and sigma 1:
       TH1F h1("h1", "histo from a gaussian", 100, -3, 3);
       h1.FillRandom("gaus", 10000);
TH1::GetRandom can be used to return a random number distributed
according the contents of an histogram.
Making a copy of an histogram
Like for any other ROOT object derived from TObject, one can use the Clone() function. This makes an identical copy of the original histogram including all associated errors and functions, e.g.:
TH1F *hnew = (TH1F*)h->Clone("hnew");
Normalizing histograms
One can scale an histogram such that the bins integral is equal to the normalization parameter via TH1::Scale(Double_t norm), where norm is the desired normalization divided by the integral of the histogram.Drawing histograms
Histograms are drawn via the THistPainter class. Each histogram has a pointer to its own painter (to be usable in a multithreaded program). Many drawing options are supported. See THistPainter::Paint() for more details.The same histogram can be drawn with different options in different pads. When an histogram drawn in a pad is deleted, the histogram is automatically removed from the pad or pads where it was drawn. If an histogram is drawn in a pad, then filled again, the new status of the histogram will be automatically shown in the pad next time the pad is updated. One does not need to redraw the histogram. To draw the current version of an histogram in a pad, one can use
h->DrawCopy();
This makes a clone (see Clone below) of the histogram. Once the clone
is drawn, the original histogram may be modified or deleted without
affecting the aspect of the clone.
One can use TH1::SetMaximum() and TH1::SetMinimum() to force a particular value for the maximum or the minimum scale on the plot. (For 1-D histograms this means the y-axis, while for 2-D histograms these functions affect the z-axis).
TH1::UseCurrentStyle() can be used to change all histogram graphics attributes to correspond to the current selected style. This function must be called for each histogram. In case one reads and draws many histograms from a file, one can force the histograms to inherit automatically the current graphics style by calling before gROOT->ForceStyle().
Setting Drawing histogram contour levels (2-D hists only)
By default contours are automatically generated at equidistant intervals. A default value of 20 levels is used. This can be modified via TH1::SetContour() or TH1::SetContourLevel(). the contours level info is used by the drawing options "cont", "surf", and "lego".Setting histogram graphics attributes
The histogram classes inherit from the attribute classes: TAttLine, TAttFill, and TAttMarker. See the member functions of these classes for the list of options.Giving titles to the X, Y and Z axis
       h->GetXaxis()->SetTitle("X axis title");
       h->GetYaxis()->SetTitle("Y axis title");
The histogram title and the axis titles can be any TLatex string.
The titles are part of the persistent histogram.
It is also possible to specify the histogram title and the axis
titles at creation time. These titles can be given in the "title"
parameter. They must be separated by ";":
TH1F* h=new TH1F("h", "Histogram title;X Axis;Y Axis;Z Axis", 100, 0, 1);
Any title can be omitted:
        TH1F* h=new TH1F("h", "Histogram title;;Y Axis", 100, 0, 1);
        TH1F* h=new TH1F("h", ";;Y Axis", 100, 0, 1);
The method SetTitle has the same syntax:
h->SetTitle("Histogram title;Another X title Axis");
Saving/Reading histograms to/from a ROOT file
The following statements create a ROOT file and store an histogram on the file. Because TH1 derives from TNamed, the key identifier on the file is the histogram name:
        TFile f("histos.root", "new");
        TH1F h1("hgaus", "histo from a gaussian", 100, -3, 3);
        h1.FillRandom("gaus", 10000);
        h1->Write();
To read this histogram in another Root session, do:
        TFile f("histos.root");
        TH1F *h = (TH1F*)f.Get("hgaus");
One can save all histograms in memory to the file by:
file->Write();
Miscelaneous operations
        TH1::KolmogorovTest(): statistical test of compatibility in shape
                             between two histograms
        TH1::Smooth() smooths the bin contents of a 1-d histogram
        TH1::Integral() returns the integral of bin contents in a given bin range
        TH1::GetMean(int axis) returns the mean value along axis
        TH1::GetRMS(int axis)  returns the sigma distribution along axis
        TH1::GetEntries() returns the number of entries
        TH1::Reset() resets the bin contents and errors of an histogram
Function Members (Methods)
| virtual | ~TH1() |
| void | TObject::AbstractMethod(const char* method) const |
| virtual Bool_t | Add(const TH1* h1, Double_t c1 = 1) |
| virtual Bool_t | Add(TF1* h1, Double_t c1 = 1, Option_t* option = "") |
| virtual Bool_t | Add(const TH1* h, const TH1* h2, Double_t c1 = 1, Double_t c2 = 1)MENU |
| virtual void | AddBinContent(Int_t bin) |
| virtual void | AddBinContent(Int_t bin, Double_t w) |
| static void | AddDirectory(Bool_t add = kTRUE) |
| static Bool_t | AddDirectoryStatus() |
| virtual Double_t | AndersonDarlingTest(const TH1* h2, Option_t* option = "") const |
| virtual Double_t | AndersonDarlingTest(const TH1* h2, Double_t& advalue) const |
| virtual void | TObject::AppendPad(Option_t* option = "") |
| virtual void | Browse(TBrowser* b) |
| virtual Int_t | BufferEmpty(Int_t action = 0) |
| virtual Bool_t | CanExtendAllAxes() const |
| virtual Double_t | Chi2Test(const TH1* h2, Option_t* option = "UU", Double_t* res = 0) const |
| virtual Double_t | Chi2TestX(const TH1* h2, Double_t& chi2, Int_t& ndf, Int_t& igood, Option_t* option = "UU", Double_t* res = 0) const |
| virtual Double_t | Chisquare(TF1* f1, Option_t* option = "") const |
| static TClass* | Class() |
| virtual const char* | TObject::ClassName() const |
| virtual void | TNamed::Clear(Option_t* option = "") |
| virtual void | ClearUnderflowAndOverflow() |
| virtual TObject* | Clone(const char* newname = 0) const |
| virtual Int_t | TNamed::Compare(const TObject* obj) const |
| virtual Double_t | ComputeIntegral(Bool_t onlyPositive = false) |
| virtual void | Copy(TObject& hnew) const |
| virtual void | TObject::Delete(Option_t* option = "")MENU |
| virtual void | DirectoryAutoAdd(TDirectory*) |
| Int_t | TAttLine::DistancetoLine(Int_t px, Int_t py, Double_t xp1, Double_t yp1, Double_t xp2, Double_t yp2) |
| virtual Int_t | DistancetoPrimitive(Int_t px, Int_t py) |
| virtual Bool_t | Divide(const TH1* h1) |
| virtual Bool_t | Divide(TF1* f1, Double_t c1 = 1) |
| virtual Bool_t | Divide(const TH1* h1, const TH1* h2, Double_t c1 = 1, Double_t c2 = 1, Option_t* option = "")MENU |
| virtual void | Draw(Option_t* option = "") |
| virtual void | TObject::DrawClass() constMENU |
| virtual TObject* | TObject::DrawClone(Option_t* option = "") constMENU |
| virtual TH1* | DrawCopy(Option_t* option = "", const char* name_postfix = "_copy") const |
| virtual TH1* | DrawNormalized(Option_t* option = "", Double_t norm = 1) const |
| virtual void | DrawPanel()MENU |
| virtual void | TObject::Dump() constMENU |
| virtual void | TObject::Error(const char* method, const char* msgfmt) const |
| virtual void | Eval(TF1* f1, Option_t* option = "") |
| virtual void | TObject::Execute(const char* method, const char* params, Int_t* error = 0) |
| virtual void | TObject::Execute(TMethod* method, TObjArray* params, Int_t* error = 0) |
| virtual void | ExecuteEvent(Int_t event, Int_t px, Int_t py) |
| virtual void | ExtendAxis(Double_t x, TAxis* axis) |
| virtual void | TObject::Fatal(const char* method, const char* msgfmt) const |
| virtual TH1* | FFT(TH1* h_output, Option_t* option) |
| virtual Int_t | Fill(Double_t x) |
| virtual Int_t | Fill(Double_t x, Double_t w) |
| virtual Int_t | Fill(const char* name, Double_t w) |
| virtual void | TNamed::FillBuffer(char*& buffer) |
| virtual void | FillN(Int_t ntimes, const Double_t* x, const Double_t* w, Int_t stride = 1) |
| virtual void | FillN(Int_t, const Double_t*, const Double_t*, const Double_t*, Int_t) |
| virtual void | FillRandom(const char* fname, Int_t ntimes = 5000) |
| virtual void | FillRandom(TH1* h, Int_t ntimes = 5000) |
| virtual Int_t | FindBin(Double_t x, Double_t y = 0, Double_t z = 0) |
| virtual Int_t | FindFirstBinAbove(Double_t threshold = 0, Int_t axis = 1) const |
| virtual Int_t | FindFixBin(Double_t x, Double_t y = 0, Double_t z = 0) const |
| virtual Int_t | FindLastBinAbove(Double_t threshold = 0, Int_t axis = 1) const |
| virtual TObject* | FindObject(const char* name) const |
| virtual TObject* | FindObject(const TObject* obj) const |
| virtual TFitResultPtr | Fit(const char* formula, Option_t* option = "", Option_t* goption = "", Double_t xmin = 0, Double_t xmax = 0)MENU |
| virtual TFitResultPtr | Fit(TF1* f1, Option_t* option = "", Option_t* goption = "", Double_t xmin = 0, Double_t xmax = 0) |
| static Int_t | FitOptionsMake(Option_t* option, Foption_t& Foption) |
| virtual void | FitPanel()MENU |
| TH1* | GetAsymmetry(TH1* h2, Double_t c2 = 1, Double_t dc2 = 0) |
| virtual Color_t | GetAxisColor(Option_t* axis = "X") const |
| virtual Float_t | GetBarOffset() const |
| virtual Float_t | GetBarWidth() const |
| virtual Int_t | GetBin(Int_t binx, Int_t biny = 0, Int_t binz = 0) const |
| virtual Double_t | GetBinCenter(Int_t bin) const |
| virtual Double_t | GetBinContent(Int_t bin) const |
| virtual Double_t | GetBinContent(Int_t bin, Int_t) const |
| virtual Double_t | GetBinContent(Int_t bin, Int_t, Int_t) const |
| virtual Double_t | GetBinError(Int_t bin) const |
| virtual Double_t | GetBinError(Int_t binx, Int_t biny) const |
| virtual Double_t | GetBinError(Int_t binx, Int_t biny, Int_t binz) const |
| virtual Double_t | GetBinErrorLow(Int_t bin) const |
| virtual TH1::EBinErrorOpt | GetBinErrorOption() const |
| virtual Double_t | GetBinErrorUp(Int_t bin) const |
| virtual Double_t | GetBinLowEdge(Int_t bin) const |
| virtual Double_t | GetBinWidth(Int_t bin) const |
| virtual Double_t | GetBinWithContent(Double_t c, Int_t& binx, Int_t firstx = 0, Int_t lastx = 0, Double_t maxdiff = 0) const |
| virtual void | GetBinXYZ(Int_t binglobal, Int_t& binx, Int_t& biny, Int_t& binz) const |
| const Double_t* | GetBuffer() const |
| Int_t | GetBufferLength() const |
| Int_t | GetBufferSize() const |
| virtual Double_t | GetCellContent(Int_t binx, Int_t biny) const |
| virtual Double_t | GetCellError(Int_t binx, Int_t biny) const |
| virtual void | GetCenter(Double_t* center) const |
| virtual Int_t | GetContour(Double_t* levels = 0) |
| virtual Double_t | GetContourLevel(Int_t level) const |
| virtual Double_t | GetContourLevelPad(Int_t level) const |
| TH1* | GetCumulative(Bool_t forward = kTRUE, const char* suffix = "_cumulative") const |
| static Int_t | GetDefaultBufferSize() |
| static Bool_t | GetDefaultSumw2() |
| virtual Int_t | GetDimension() const |
| TDirectory* | GetDirectory() const |
| virtual Option_t* | TObject::GetDrawOption() const |
| static Long_t | TObject::GetDtorOnly() |
| virtual Double_t | GetEffectiveEntries() const |
| virtual Double_t | GetEntries() const |
| virtual Color_t | TAttFill::GetFillColor() const |
| virtual Style_t | TAttFill::GetFillStyle() const |
| virtual TF1* | GetFunction(const char* name) const |
| virtual const char* | TObject::GetIconName() const |
| virtual Double_t* | GetIntegral() |
| virtual Double_t | GetKurtosis(Int_t axis = 1) const |
| virtual Color_t | GetLabelColor(Option_t* axis = "X") const |
| virtual Style_t | GetLabelFont(Option_t* axis = "X") const |
| virtual Float_t | GetLabelOffset(Option_t* axis = "X") const |
| virtual Float_t | GetLabelSize(Option_t* axis = "X") const |
| virtual Color_t | TAttLine::GetLineColor() const |
| virtual Style_t | TAttLine::GetLineStyle() const |
| virtual Width_t | TAttLine::GetLineWidth() const |
| TList* | GetListOfFunctions() const |
| virtual void | GetLowEdge(Double_t* edge) const |
| virtual Color_t | TAttMarker::GetMarkerColor() const |
| virtual Size_t | TAttMarker::GetMarkerSize() const |
| virtual Style_t | TAttMarker::GetMarkerStyle() const |
| virtual Double_t | GetMaximum(Double_t maxval = 3.40282347E+38F) const |
| virtual Int_t | GetMaximumBin() const |
| virtual Int_t | GetMaximumBin(Int_t& locmax, Int_t& locmay, Int_t& locmaz) const |
| virtual Double_t | GetMaximumStored() const |
| virtual Double_t | GetMean(Int_t axis = 1) const |
| virtual Double_t | GetMeanError(Int_t axis = 1) const |
| virtual Double_t | GetMinimum(Double_t minval = -3.40282347E+38F) const |
| virtual Int_t | GetMinimumBin() const |
| virtual Int_t | GetMinimumBin(Int_t& locmix, Int_t& locmiy, Int_t& locmiz) const |
| virtual Double_t | GetMinimumStored() const |
| virtual const char* | TNamed::GetName() const |
| virtual Int_t | GetNbinsX() const |
| virtual Int_t | GetNbinsY() const |
| virtual Int_t | GetNbinsZ() const |
| virtual Int_t | GetNcells() const |
| virtual Int_t | GetNdivisions(Option_t* axis = "X") const |
| virtual Double_t | GetNormFactor() const |
| virtual char* | GetObjectInfo(Int_t px, Int_t py) const |
| static Bool_t | TObject::GetObjectStat() |
| virtual Option_t* | GetOption() const |
| TVirtualHistPainter* | GetPainter(Option_t* option = "") |
| virtual Int_t | GetQuantiles(Int_t nprobSum, Double_t* q, const Double_t* probSum = 0) |
| virtual Double_t | GetRandom() const |
| virtual Double_t | GetRMS(Int_t axis = 1) const |
| virtual Double_t | GetRMSError(Int_t axis = 1) const |
| virtual Double_t | GetSkewness(Int_t axis = 1) const |
| virtual void | GetStats(Double_t* stats) const |
| Double_t | GetStdDev(Int_t axis = 1) const |
| Double_t | GetStdDevError(Int_t axis = 1) const |
| virtual Double_t | GetSumOfWeights() const |
| virtual TArrayD* | GetSumw2() |
| virtual const TArrayD* | GetSumw2() const |
| virtual Int_t | GetSumw2N() const |
| virtual Float_t | GetTickLength(Option_t* axis = "X") const |
| virtual const char* | TNamed::GetTitle() const |
| virtual Style_t | GetTitleFont(Option_t* axis = "X") const |
| virtual Float_t | GetTitleOffset(Option_t* axis = "X") const |
| virtual Float_t | GetTitleSize(Option_t* axis = "X") const |
| virtual UInt_t | TObject::GetUniqueID() const |
| TAxis* | GetXaxis() |
| const TAxis* | GetXaxis() const |
| TAxis* | GetYaxis() |
| const TAxis* | GetYaxis() const |
| TAxis* | GetZaxis() |
| const TAxis* | GetZaxis() const |
| virtual Bool_t | TObject::HandleTimer(TTimer* timer) |
| virtual ULong_t | TNamed::Hash() const |
| virtual void | TObject::Info(const char* method, const char* msgfmt) const |
| virtual Bool_t | TObject::InheritsFrom(const char* classname) const |
| virtual Bool_t | TObject::InheritsFrom(const TClass* cl) const |
| virtual void | TObject::Inspect() constMENU |
| virtual Double_t | Integral(Option_t* option = "") const |
| virtual Double_t | Integral(Int_t binx1, Int_t binx2, Option_t* option = "") const |
| virtual Double_t | IntegralAndError(Int_t binx1, Int_t binx2, Double_t& err, Option_t* option = "") const |
| virtual Double_t | Interpolate(Double_t x) |
| virtual Double_t | Interpolate(Double_t x, Double_t y) |
| virtual Double_t | Interpolate(Double_t x, Double_t y, Double_t z) |
| void | TObject::InvertBit(UInt_t f) |
| virtual TClass* | IsA() const |
| Bool_t | IsBinOverflow(Int_t bin) const |
| Bool_t | IsBinUnderflow(Int_t bin) const |
| virtual Bool_t | TObject::IsEqual(const TObject* obj) const |
| virtual Bool_t | TObject::IsFolder() const |
| Bool_t | TObject::IsOnHeap() const |
| virtual Bool_t | TNamed::IsSortable() const |
| virtual Bool_t | TAttFill::IsTransparent() const |
| Bool_t | TObject::IsZombie() const |
| virtual Double_t | KolmogorovTest(const TH1* h2, Option_t* option = "") const |
| virtual void | LabelsDeflate(Option_t* axis = "X") |
| virtual void | LabelsInflate(Option_t* axis = "X") |
| virtual void | LabelsOption(Option_t* option = "h", Option_t* axis = "X") |
| virtual void | TNamed::ls(Option_t* option = "") const |
| void | TObject::MayNotUse(const char* method) const |
| virtual Long64_t | Merge(TCollection* list) |
| virtual void | TAttLine::Modify() |
| virtual Bool_t | Multiply(const TH1* h1) |
| virtual Bool_t | Multiply(TF1* h1, Double_t c1 = 1) |
| virtual Bool_t | Multiply(const TH1* h1, const TH1* h2, Double_t c1 = 1, Double_t c2 = 1, Option_t* option = "")MENU |
| virtual Bool_t | TObject::Notify() |
| void | TObject::Obsolete(const char* method, const char* asOfVers, const char* removedFromVers) const |
| void | TObject::operator delete(void* ptr) |
| void | TObject::operator delete(void* ptr, void* vp) |
| void | TObject::operator delete[](void* ptr) |
| void | TObject::operator delete[](void* ptr, void* vp) |
| void* | TObject::operator new(size_t sz) |
| void* | TObject::operator new(size_t sz, void* vp) |
| void* | TObject::operator new[](size_t sz) |
| void* | TObject::operator new[](size_t sz, void* vp) |
| virtual void | Paint(Option_t* option = "") |
| virtual void | TObject::Pop() |
| virtual void | Print(Option_t* option = "") const |
| virtual void | PutStats(Double_t* stats) |
| virtual Int_t | TObject::Read(const char* name) |
| virtual TH1* | Rebin(Int_t ngroup = 2, const char* newname = "", const Double_t* xbins = 0)MENU |
| virtual void | RebinAxis(Double_t x, TAxis* axis) |
| virtual TH1* | RebinX(Int_t ngroup = 2, const char* newname = "") |
| virtual void | Rebuild(Option_t* option = "") |
| virtual void | RecursiveRemove(TObject* obj) |
| virtual void | Reset(Option_t* option = "") |
| virtual void | TAttFill::ResetAttFill(Option_t* option = "") |
| virtual void | TAttLine::ResetAttLine(Option_t* option = "") |
| virtual void | TAttMarker::ResetAttMarker(Option_t* toption = "") |
| void | TObject::ResetBit(UInt_t f) |
| virtual void | ResetStats() |
| virtual void | TObject::SaveAs(const char* filename = "", Option_t* option = "") constMENU |
| virtual void | TAttFill::SaveFillAttributes(ostream& out, const char* name, Int_t coldef = 1, Int_t stydef = 1001) |
| virtual void | TAttLine::SaveLineAttributes(ostream& out, const char* name, Int_t coldef = 1, Int_t stydef = 1, Int_t widdef = 1) |
| virtual void | TAttMarker::SaveMarkerAttributes(ostream& out, const char* name, Int_t coldef = 1, Int_t stydef = 1, Int_t sizdef = 1) |
| virtual void | SavePrimitive(ostream& out, Option_t* option = "") |
| virtual void | Scale(Double_t c1 = 1, Option_t* option = "") |
| virtual void | SetAxisColor(Color_t color = 1, Option_t* axis = "X") |
| virtual void | SetAxisRange(Double_t xmin, Double_t xmax, Option_t* axis = "X") |
| virtual void | SetBarOffset(Float_t offset = 0.25) |
| virtual void | SetBarWidth(Float_t width = 0.5) |
| virtual void | SetBinContent(Int_t bin, Double_t content) |
| virtual void | SetBinContent(Int_t bin, Int_t, Double_t content) |
| virtual void | SetBinContent(Int_t bin, Int_t, Int_t, Double_t content) |
| virtual void | SetBinError(Int_t bin, Double_t error) |
| virtual void | SetBinError(Int_t binx, Int_t biny, Double_t error) |
| virtual void | SetBinError(Int_t binx, Int_t biny, Int_t binz, Double_t error) |
| virtual void | SetBinErrorOption(TH1::EBinErrorOpt type) |
| virtual void | SetBins(Int_t nx, const Double_t* xBins) |
| virtual void | SetBins(Int_t nx, Double_t xmin, Double_t xmax) |
| virtual void | SetBins(Int_t nx, const Double_t* xBins, Int_t ny, const Double_t* yBins) |
| virtual void | SetBins(Int_t nx, Double_t xmin, Double_t xmax, Int_t ny, Double_t ymin, Double_t ymax) |
| virtual void | SetBins(Int_t nx, const Double_t* xBins, Int_t ny, const Double_t* yBins, Int_t nz, const Double_t* zBins) |
| virtual void | SetBins(Int_t nx, Double_t xmin, Double_t xmax, Int_t ny, Double_t ymin, Double_t ymax, Int_t nz, Double_t zmin, Double_t zmax) |
| virtual void | SetBinsLength(Int_t = -1) |
| void | TObject::SetBit(UInt_t f) |
| void | TObject::SetBit(UInt_t f, Bool_t set) |
| virtual void | SetBuffer(Int_t buffersize, Option_t* option = "") |
| virtual UInt_t | SetCanExtend(UInt_t extendBitMask) |
| virtual void | SetCellContent(Int_t binx, Int_t biny, Double_t content) |
| virtual void | SetCellError(Int_t binx, Int_t biny, Double_t content) |
| virtual void | SetContent(const Double_t* content) |
| virtual void | SetContour(Int_t nlevels, const Double_t* levels = 0) |
| virtual void | SetContourLevel(Int_t level, Double_t value) |
| static void | SetDefaultBufferSize(Int_t buffersize = 1000) |
| static void | SetDefaultSumw2(Bool_t sumw2 = kTRUE) |
| virtual void | SetDirectory(TDirectory* dir) |
| virtual void | TObject::SetDrawOption(Option_t* option = "")MENU |
| static void | TObject::SetDtorOnly(void* obj) |
| virtual void | SetEntries(Double_t n) |
| virtual void | SetError(const Double_t* error) |
| virtual void | TAttFill::SetFillAttributes()MENU |
| virtual void | TAttFill::SetFillColor(Color_t fcolor) |
| virtual void | TAttFill::SetFillColorAlpha(Color_t fcolor, Float_t falpha) |
| virtual void | TAttFill::SetFillStyle(Style_t fstyle) |
| virtual void | SetLabelColor(Color_t color = 1, Option_t* axis = "X") |
| virtual void | SetLabelFont(Style_t font = 62, Option_t* axis = "X") |
| virtual void | SetLabelOffset(Float_t offset = 0.0050000000000000001, Option_t* axis = "X") |
| virtual void | SetLabelSize(Float_t size = 0.02, Option_t* axis = "X") |
| virtual void | TAttLine::SetLineAttributes()MENU |
| virtual void | TAttLine::SetLineColor(Color_t lcolor) |
| virtual void | TAttLine::SetLineColorAlpha(Color_t lcolor, Float_t lalpha) |
| virtual void | TAttLine::SetLineStyle(Style_t lstyle) |
| virtual void | TAttLine::SetLineWidth(Width_t lwidth) |
| virtual void | TAttMarker::SetMarkerAttributes()MENU |
| virtual void | TAttMarker::SetMarkerColor(Color_t mcolor = 1) |
| virtual void | TAttMarker::SetMarkerColorAlpha(Color_t mcolor, Float_t malpha) |
| virtual void | TAttMarker::SetMarkerSize(Size_t msize = 1) |
| virtual void | TAttMarker::SetMarkerStyle(Style_t mstyle = 1) |
| virtual void | SetMaximum(Double_t maximum = -1111)MENU |
| virtual void | SetMinimum(Double_t minimum = -1111)MENU |
| virtual void | SetName(const char* name)MENU |
| virtual void | SetNameTitle(const char* name, const char* title) |
| virtual void | SetNdivisions(Int_t n = 510, Option_t* axis = "X") |
| virtual void | SetNormFactor(Double_t factor = 1) |
| static void | TObject::SetObjectStat(Bool_t stat) |
| virtual void | SetOption(Option_t* option = " ") |
| virtual void | SetStats(Bool_t stats = kTRUE)MENU |
| virtual void | SetTickLength(Float_t length = 0.02, Option_t* axis = "X") |
| virtual void | SetTitle(const char* title)MENU |
| virtual void | SetTitleFont(Style_t font = 62, Option_t* axis = "X") |
| virtual void | SetTitleOffset(Float_t offset = 1, Option_t* axis = "X") |
| virtual void | SetTitleSize(Float_t size = 0.02, Option_t* axis = "X") |
| virtual void | TObject::SetUniqueID(UInt_t uid) |
| virtual void | SetXTitle(const char* title) |
| virtual void | SetYTitle(const char* title) |
| virtual void | SetZTitle(const char* title) |
| virtual TH1* | ShowBackground(Int_t niter = 20, Option_t* option = "same")MENU |
| virtual void | ShowMembers(TMemberInspector& insp) const |
| virtual Int_t | ShowPeaks(Double_t sigma = 2, Option_t* option = "", Double_t threshold = 0.050000000000000003)MENU |
| virtual Int_t | TNamed::Sizeof() const |
| virtual void | Smooth(Int_t ntimes = 1, Option_t* option = "")MENU |
| static void | SmoothArray(Int_t NN, Double_t* XX, Int_t ntimes = 1) |
| static void | StatOverflows(Bool_t flag = kTRUE) |
| virtual void | Streamer(TBuffer&) |
| void | StreamerNVirtual(TBuffer& ClassDef_StreamerNVirtual_b) |
| virtual void | Sumw2(Bool_t flag = kTRUE) |
| virtual void | TObject::SysError(const char* method, const char* msgfmt) const |
| Bool_t | TObject::TestBit(UInt_t f) const |
| Int_t | TObject::TestBits(UInt_t f) const |
| static TH1* | TransformHisto(TVirtualFFT* fft, TH1* h_output, Option_t* option) |
| virtual void | UseCurrentStyle() |
| virtual void | TObject::Warning(const char* method, const char* msgfmt) const |
| virtual Int_t | TObject::Write(const char* name = 0, Int_t option = 0, Int_t bufsize = 0) |
| virtual Int_t | TObject::Write(const char* name = 0, Int_t option = 0, Int_t bufsize = 0) const |
| virtual Int_t | BufferFill(Double_t x, Double_t w) |
| static bool | CheckAxisLimits(const TAxis* a1, const TAxis* a2) |
| static bool | CheckBinLabels(const TAxis* a1, const TAxis* a2) |
| static bool | CheckBinLimits(const TAxis* a1, const TAxis* a2) |
| static bool | CheckConsistency(const TH1* h1, const TH1* h2) |
| static bool | CheckConsistentSubAxes(const TAxis* a1, Int_t firstBin1, Int_t lastBin1, const TAxis* a2, Int_t firstBin2 = 0, Int_t lastBin2 = 0) |
| static bool | CheckEqualAxes(const TAxis* a1, const TAxis* a2) |
| virtual void | TObject::DoError(int level, const char* location, const char* fmt, va_list va) const |
| virtual void | DoFillN(Int_t ntimes, const Double_t* x, const Double_t* w, Int_t stride = 1) |
| virtual Double_t | DoIntegral(Int_t ix1, Int_t ix2, Int_t iy1, Int_t iy2, Int_t iz1, Int_t iz2, Double_t& err, Option_t* opt, Bool_t doerr = kFALSE) const |
| virtual Bool_t | FindNewAxisLimits(const TAxis* axis, const Double_t point, Double_t& newMin, Double_t& newMax) |
| virtual Double_t | GetBinErrorSqUnchecked(Int_t bin) const |
| void | TObject::MakeZombie() |
| static Bool_t | RecomputeAxisLimits(TAxis& destAxis, const TAxis& anAxis) |
| virtual Double_t | RetrieveBinContent(Int_t bin) const |
| static Bool_t | SameLimitsAndNBins(const TAxis& axis1, const TAxis& axis2) |
| virtual void | SavePrimitiveHelp(ostream& out, const char* hname, Option_t* option = "") |
| TH1() | |
| TH1(const char* name, const char* title, Int_t nbinsx, const Float_t* xbins) | |
| TH1(const char* name, const char* title, Int_t nbinsx, const Double_t* xbins) | |
| TH1(const char* name, const char* title, Int_t nbinsx, Double_t xlow, Double_t xup) | |
| virtual void | UpdateBinContent(Int_t bin, Double_t content) |
Data Members
| static TH1::(anonymous) | kAllAxes | |
| static TObject::(anonymous) | TObject::kBitMask | |
| static TObject::EStatusBits | TObject::kCanDelete | |
| static TH1::(anonymous) | kCanRebin | |
| static TObject::EStatusBits | TObject::kCannotPick | |
| static TObject::EStatusBits | TObject::kHasUUID | |
| static TObject::EStatusBits | TObject::kInvalidObject | |
| static TH1::(anonymous) | kIsAverage | |
| static TH1::(anonymous) | kIsNotW | |
| static TObject::(anonymous) | TObject::kIsOnHeap | |
| static TObject::EStatusBits | TObject::kIsReferenced | |
| static TH1::(anonymous) | kIsZoomed | |
| static TH1::(anonymous) | kLogX | |
| static TObject::EStatusBits | TObject::kMustCleanup | |
| static TH1::(anonymous) | kNoAxis | |
| static TObject::EStatusBits | TObject::kNoContextMenu | |
| static TH1::(anonymous) | kNoStats | |
| static TH1::(anonymous) | kNoTitle | |
| static TH1::EBinErrorOpt | kNormal | |
| static TObject::(anonymous) | TObject::kNotDeleted | |
| static TH1::(anonymous) | kNstat | |
| static TObject::EStatusBits | TObject::kObjInCanvas | |
| static TObject::(anonymous) | TObject::kOverwrite | |
| static TH1::EBinErrorOpt | kPoisson | |
| static TH1::EBinErrorOpt | kPoisson2 | |
| static TObject::(anonymous) | TObject::kSingleKey | |
| static TH1::(anonymous) | kUserContour | |
| static TObject::(anonymous) | TObject::kWriteDelete | |
| static TH1::(anonymous) | kXaxis | |
| static TH1::(anonymous) | kYaxis | |
| static TH1::(anonymous) | kZaxis | |
| static TObject::(anonymous) | TObject::kZombie |
| Short_t | fBarOffset | (1000*offset) for bar charts or legos |
| Short_t | fBarWidth | (1000*width) for bar charts or legos |
| TH1::EBinErrorOpt | fBinStatErrOpt | option for bin statistical errors |
| Double_t* | fBuffer | [fBufferSize] entry buffer |
| Int_t | fBufferSize | fBuffer size |
| TArrayD | fContour | Array to display contour levels |
| Int_t | fDimension | !Histogram dimension (1, 2 or 3 dim) |
| TDirectory* | fDirectory | !Pointer to directory holding this histogram |
| Double_t | fEntries | Number of entries |
| Color_t | TAttFill::fFillColor | fill area color |
| Style_t | TAttFill::fFillStyle | fill area style |
| TList* | fFunctions | ->Pointer to list of functions (fits and user) |
| Double_t* | fIntegral | !Integral of bins used by GetRandom |
| Color_t | TAttLine::fLineColor | line color |
| Style_t | TAttLine::fLineStyle | line style |
| Width_t | TAttLine::fLineWidth | line width |
| Color_t | TAttMarker::fMarkerColor | Marker color index |
| Size_t | TAttMarker::fMarkerSize | Marker size |
| Style_t | TAttMarker::fMarkerStyle | Marker style |
| Double_t | fMaximum | Maximum value for plotting |
| Double_t | fMinimum | Minimum value for plotting |
| TString | TNamed::fName | object identifier |
| Int_t | fNcells | number of bins(1D), cells (2D) +U/Overflows |
| Double_t | fNormFactor | Normalization factor |
| TString | fOption | histogram options |
| TVirtualHistPainter* | fPainter | !pointer to histogram painter |
| TArrayD | fSumw2 | Array of sum of squares of weights |
| TString | TNamed::fTitle | object title |
| Double_t | fTsumw | Total Sum of weights |
| Double_t | fTsumw2 | Total Sum of squares of weights |
| Double_t | fTsumwx | Total Sum of weight*X |
| Double_t | fTsumwx2 | Total Sum of weight*X*X |
| TAxis | fXaxis | X axis descriptor |
| TAxis | fYaxis | Y axis descriptor |
| TAxis | fZaxis | Z axis descriptor |
| static Bool_t | fgAddDirectory | !flag to add histograms to the directory |
| static Int_t | fgBufferSize | !default buffer size for automatic histograms |
| static Bool_t | fgDefaultSumw2 | !flag to call TH1::Sumw2 automatically at histogram creation time |
| static Bool_t | fgStatOverflows | !flag to use under/overflows in statistics |
Class Charts
Function documentation
 Normal constructor for fix bin size histograms.

     Creates the main histogram structure:
        name   : name of histogram (avoid blanks)
        title  : histogram title
                 if title is of the form "stringt;stringx;stringy;stringz"
                 the histogram title is set to stringt,
                 the x axis title to stringy, the y axis title to stringy, etc.
        nbins  : number of bins
        xlow   : low edge of first bin
        xup    : upper edge of last bin (not included in last bin)

      When an histogram is created, it is automatically added to the list
      of special objects in the current directory.
      To find the pointer to this histogram in the current directory
      by its name, do:
      TH1F *h1 = (TH1F*)gDirectory->FindObject(name);
 Normal constructor for variable bin size histograms.

  Creates the main histogram structure:
     name   : name of histogram (avoid blanks)
     title  : histogram title
              if title is of the form "stringt;stringx;stringy;stringz"
              the histogram title is set to stringt,
              the x axis title to stringx, the y axis title to stringy, etc.
     nbins  : number of bins
     xbins  : array of low-edges for each bin
              This is an array of size nbins+1
 Performs the operation: this = this + c1*f1
 if errors are defined (see TH1::Sumw2), errors are also recalculated.

 By default, the function is computed at the centre of the bin.
 if option "I" is specified (1-d histogram only), the integral of the
 function in each bin is used instead of the value of the function at
 the centre of the bin.
 Only bins inside the function range are recomputed.
 IMPORTANT NOTE: If you intend to use the errors of this histogram later
 you should call Sumw2 before making this operation.
 This is particularly important if you fit the histogram after TH1::Add

 The function return kFALSE if the Add operation failed
 Performs the operation: this = this + c1*h1
 if errors are defined (see TH1::Sumw2), errors are also recalculated.
 Note that if h1 has Sumw2 set, Sumw2 is automatically called for this
 if not already set.
 Note also that adding histogram with labels is not supported, histogram will be
 added merging them by bin number independently of the labels.
 For adding histogram with labels one should use TH1::Merge

 SPECIAL CASE (Average/Efficiency histograms)
 For histograms representing averages or efficiencies, one should compute the average
 of the two histograms and not the sum. One can mark a histogram to be an average
 histogram by setting its bit kIsAverage with
    myhist.SetBit(TH1::kIsAverage);
 Note that the two histograms must have their kIsAverage bit set

 IMPORTANT NOTE1: If you intend to use the errors of this histogram later
 you should call Sumw2 before making this operation.
 This is particularly important if you fit the histogram after TH1::Add

 IMPORTANT NOTE2: if h1 has a normalisation factor, the normalisation factor
 is used , ie  this = this + c1*factor*h1
 Use the other TH1::Add function if you do not want this feature

 The function return kFALSE if the Add operation failed
 Replace contents of this histogram by the addition of h1 and h2.

   this = c1*h1 + c2*h2
   if errors are defined (see TH1::Sumw2), errors are also recalculated
   Note that if h1 or h2 have Sumw2 set, Sumw2 is automatically called for this
   if not already set.
   Note also that adding histogram with labels is not supported, histogram will be
   added merging them by bin number independently of the labels.
   For adding histogram ith labels one should use TH1::Merge

 SPECIAL CASE (Average/Efficiency histograms)
 For histograms representing averages or efficiencies, one should compute the average
 of the two histograms and not the sum. One can mark a histogram to be an average
 histogram by setting its bit kIsAverage with
    myhist.SetBit(TH1::kIsAverage);
 Note that the two histograms must have their kIsAverage bit set

 IMPORTANT NOTE: If you intend to use the errors of this histogram later
 you should call Sumw2 before making this operation.
 This is particularly important if you fit the histogram after TH1::Add

 ANOTHER SPECIAL CASE : h1 = h2 and c2 < 0
 do a scaling   this = c1 * h1 / (bin Volume)

 The function returns kFALSE if the Add operation failed
 Sets the flag controlling the automatic add of histograms in memory

 By default (fAddDirectory = kTRUE), histograms are automatically added
 to the list of objects in memory.
 Note that one histogram can be removed from its support directory
 by calling h->SetDirectory(0) or h->SetDirectory(dir) to add it
 to the list of objects in the directory dir.

  NOTE that this is a static function. To call it, use;
     TH1::AddDirectory
 Fill histogram with all entries in the buffer.
 action = -1 histogram is reset and refilled from the buffer (called by THistPainter::Paint)
 action =  0 histogram is reset and filled from the buffer. When the histogram is filled from the
             buffer the value fBuffer[0] is set to a negative number (= - number of entries)
             When calling with action == 0 the histogram is NOT refilled when fBuffer[0] is < 0
             While when calling with action = -1 the histogram is reset and ALWAYS refilled independently if
             the histogram was filled before. This is needed when drawing the histogram

 action =  1 histogram is filled and buffer is deleted
             The buffer is automatically deleted when filling the histogram and the entries is
             larger than the buffer size
 Check that the axis limits of the histograms are the same
 if a first and last bin is passed the axis is compared between the given range
 Check that two sub axis are the same
 the limits are defined by first bin and last bin
 N.B. no check is done in this case for variable bins
  test for comparing weighted and unweighted histograms

 Function: Returns p-value. Other return values are specified by the 3rd parameter <br>

 Parameters:

    - h2: the second histogram
    - option:
       o "UU" = experiment experiment comparison (unweighted-unweighted)
       o "UW" = experiment MC comparison (unweighted-weighted). Note that
          the first histogram should be unweighted
       o "WW" = MC MC comparison (weighted-weighted)
       o "NORM" = to be used when one or both of the histograms is scaled
                  but the histogram originally was unweighted
       o by default underflows and overlows are not included:
          * "OF" = overflows included
          * "UF" = underflows included
       o "P" = print chi2, ndf, p_value, igood
       o "CHI2" = returns chi2 instead of p-value
       o "CHI2/NDF" = returns
    - res: not empty - computes normalized residuals and returns them in
      this array

 The current implementation is based on the papers  test for comparison
 of weighted and unweighted histograms" in Proceedings of PHYSTAT05 and
 "Comparison weighted and unweighted histograms", arXiv:physics/0605123
 by N.Gagunashvili. This function has been implemented by Daniel Haertl in August 2006.

 Introduction:

   A frequently used technique in data analysis is the comparison of
   histograms. First suggested by Pearson [1] the  test of
   homogeneity is used widely for comparing usual (unweighted) histograms.
   This paper describes the implementation modified  tests
   for comparison of weighted and unweighted  histograms and two weighted
   histograms [2] as well as usual Pearson's  test for
   comparison two usual (unweighted) histograms.

 Overview:

   Comparison of two histograms expect hypotheses that two histograms
   represent identical distributions. To make a decision p-value should
   be calculated. The hypotheses of identity is rejected if the p-value is
   lower then some significance level. Traditionally significance levels
   0.1, 0.05 and 0.01 are used. The comparison procedure should include an
   analysis of the residuals which is often helpful in identifying the
   bins of histograms responsible for a significant overall  value.
   Residuals are the difference between bin contents and expected bin
   contents. Most convenient for analysis are the normalized residuals. If
   hypotheses of identity are valid then normalized residuals are
   approximately independent and identically distributed random variables
   having N(0,1) distribution. Analysis of residuals expect test of above
   mentioned properties of residuals. Notice that indirectly the analysis
   of residuals increase the power of  test.

 Methods of comparison:

   test for comparison two (unweighted) histograms:
   Let us consider two  histograms with the  same binning and the  number
   of bins equal to r. Let us denote the number of events in the ith bin
   in the first histogram as ni and as mi in the second one. The total
   number of events in the first histogram is equal to:


   and


   in the second histogram. The hypothesis of identity (homogeneity) [3]
   is that the two histograms represent random values with identical
   distributions. It is equivalent that there exist r constants p1,...,pr,
   such that


    and the probability of belonging to the ith bin for some measured value
    in both experiments is equal to pi. The number of events in the ith
    bin is a random variable with a distribution approximated by a Poisson
    probability distribution


   for the first histogram and with distribution


   for the second histogram. If the hypothesis of homogeneity is valid,
   then the  maximum likelihood estimator of pi, i=1,...,r, is


   and then


   has approximately a  distribution [3].
   The comparison procedure can include an analysis of the residuals which
   is often helpful in identifying the bins of histograms responsible for
   a significant overall value. Most convenient for
   analysis are the adjusted (normalized) residuals [4]


   If hypotheses of  homogeneity are valid then residuals ri are
   approximately independent and identically distributed random variables
   having N(0,1) distribution. The application of the  test has
   restrictions related to the value of the expected frequencies Npi,
   Mpi, i=1,...,r. A conservative rule formulated in [5] is that all the
   expectations must be 1 or greater for both histograms. In practical
   cases when expected frequencies are not known the estimated expected
   frequencies   can be used.

  Unweighted and weighted histograms comparison:

   A simple modification of the ideas described above can be used for the
   comparison of the usual (unweighted) and weighted histograms. Let us
   denote the number of events in the ith bin in the unweighted
   histogram as ni and the common weight of events in the ith bin of the
   weighted histogram as wi. The total number of events in the
   unweighted histogram is equal to


   and the total weight of events in the weighted histogram is equal to


   Let us formulate the hypothesis of identity of an unweighted histogram
   to a weighted histogram so that there exist r constants p1,...,pr, such
   that


   for the unweighted histogram. The weight wi is a random variable with a
   distribution approximated by the normal probability distribution
    where  is the variance of the weight wi.
   If we replace the variance
   with estimate  (sum of squares of weights of
   events in the ith bin) and the hypothesis of identity is valid, then the
   maximum likelihood estimator of  pi,i=1,...,r, is


   We may then use the test statistic


   and it has approximately a  distribution [2]. This test, as well
   as the original one [3], has a restriction on the expected frequencies. The
   expected frequencies recommended for the weighted histogram is more than 25.
   The value of the minimal expected frequency can be decreased down to 10 for
   the case when the weights of the events are close to constant. In the case
   of a weighted histogram if the number of events is unknown, then we can
   apply this recommendation for the equivalent number of events as


   The minimal expected frequency for an unweighted histogram must be 1. Notice
   that any usual (unweighted) histogram can be considered as a weighted
   histogram with events that have constant weights equal to 1.
   The variance  of the difference between the weight wi
   and the estimated expectation value of the weight is approximately equal to:


   The  residuals


   have approximately a normal distribution with mean equal to 0 and standard
   deviation  equal to 1.

  Two weighted histograms comparison:

   Let us denote the common  weight of events of the ith bin in the first
   histogram as w1i and as w2i in the second one. The total weight of events
   in the first histogram is equal to


   and


   in the second histogram. Let us formulate the hypothesis of identity of
   weighted histograms so that there exist r constants p1,...,pr, such that


   and also expectation value of weight w1i equal to W1pi and expectation value
   of weight w2i equal to W2pi. Weights in both the histograms are random
   variables with distributions which can be approximated by a normal
   probability distribution  for the first histogram
   and by a distribution  for the second.
   Here  and  are the variances
   of w1i and w2i with estimators  and  respectively.
   If the hypothesis of identity is valid, then the maximum likelihood and
   Least Square Method estimator of pi,i=1,...,r, is


   We may then use the test statistic


   and it has approximately a  distribution [2].
   The normalized or studentised residuals [6]


   have approximately a normal distribution with mean equal to 0 and standard
   deviation 1. A recommended minimal expected frequency is equal to 10 for
   the proposed test.

 Numerical examples:

   The method described herein is now illustrated with an example.
   We take a distribution


   defined on the interval [4,16]. Events distributed according to the formula
   (1) are simulated to create the unweighted histogram. Uniformly distributed
   events are simulated for the weighted histogram with weights calculated by
   formula (1). Each histogram has the same number of bins: 20. Fig.1 shows
   the result of comparison of the unweighted histogram with 200 events
   (minimal expected frequency equal to one) and the weighted histogram with
   500 events (minimal expected frequency equal to 25)


   Fig 1. An example of comparison of the unweighted histogram with 200 events
   and the weighted histogram with 500 events:
      a) unweighted histogram;
      b) weighted histogram;
      c) normalized residuals plot;
      d) normal Q-Q plot of residuals.

   The value of the test statistic  is equal to
   21.09 with p-value equal to 0.33, therefore the hypothesis of identity of
   the two histograms can be accepted for 0.05 significant level. The behavior
   of the normalized residuals plot (see Fig. 1c) and the normal Q-Q plot
   (see Fig. 1d) of residuals are regular and we cannot identify the outliers
   or bins with a big influence on .

   The second example presents the same two histograms but 17 events was added
   to content of bin number 15 in unweighted histogram. Fig.2 shows the result
   of comparison of the unweighted histogram with 217 events (minimal expected
   frequency equal to one) and the weighted histogram with 500 events (minimal
   expected frequency equal to 25)


   Fig 2. An example of comparison of the unweighted histogram with 217 events
   and the weighted histogram with 500 events:
      a) unweighted histogram;
      b) weighted histogram;
      c) normalized residuals plot;
      d) normal Q-Q plot of residuals.

   The value of the test statistic  is equal to
   32.33 with p-value equal to 0.029, therefore the hypothesis of identity of
   the two histograms is rejected for 0.05 significant level. The behavior of
   the normalized residuals plot (see Fig. 2c) and the normal Q-Q plot (see
   Fig. 2d) of residuals are not regular and we can identify the outlier or
   bin with a big influence on .

 References:

 [1] Pearson, K., 1904. On the Theory of Contingency and Its Relation to
     Association and Normal Correlation. Drapers' Co. Memoirs, Biometric
     Series No. 1, London.
 [2] Gagunashvili, N., 2006.  test for comparison
     of weighted and unweighted histograms. Statistical Problems in Particle
     Physics, Astrophysics and Cosmology, Proceedings of PHYSTAT05,
     Oxford, UK, 12-15 September 2005, Imperial College Press, London, 43-44.
     Gagunashvili,N., Comparison of weighted and unweighted histograms,
     arXiv:physics/0605123, 2006.
 [3] Cramer, H., 1946. Mathematical methods of statistics.
     Princeton University Press, Princeton.
 [4] Haberman, S.J., 1973. The analysis of residuals in cross-classified tables.
     Biometrics 29, 205-220.
 [5] Lewontin, R.C. and Felsenstein, J., 1965. The robustness of homogeneity
     test in 2xN tables. Biometrics 21, 19-33.
 [6] Seber, G.A.F., Lee, A.J., 2003, Linear Regression Analysis.
     John Wiley & Sons Inc., New York.
 The computation routine of the Chisquare test. For the method description,
 see Chi2Test() function.
 Returns p-value
 parameters:
  - h2-second histogram
  - option:
     "UU" = experiment experiment comparison (unweighted-unweighted)
     "UW" = experiment MC comparison (unweighted-weighted). Note that the first
           histogram should be unweighted
     "WW" = MC MC comparison (weighted-weighted)

     "NORM" = if one or both histograms is scaled

     "OF" = overflows included
     "UF" = underflows included
         by default underflows and overflows are not included

  - igood:
       igood=0 - no problems
        For unweighted unweighted  comparison
       igood=1'There is a bin in the 1st histogram with less than 1 event'
       igood=2'There is a bin in the 2nd histogram with less than 1 event'
       igood=3'when the conditions for igood=1 and igood=2 are satisfied'
        For  unweighted weighted  comparison
       igood=1'There is a bin in the 1st histogram with less then 1 event'
       igood=2'There is a bin in the 2nd histogram with less then 10 effective number of events'
       igood=3'when the conditions for igood=1 and igood=2 are satisfied'
        For  weighted weighted  comparison
       igood=1'There is a bin in the 1st  histogram with less then 10 effective
        number of events'
       igood=2'There is a bin in the 2nd  histogram with less then 10 effective
               number of events'
       igood=3'when the conditions for igood=1 and igood=2 are satisfied'

  - chi2 - chisquare of the test
  - ndf  - number of degrees of freedom (important, when both histograms have the same
         empty bins)
  - res -  normalized residuals for further analysis
 Compute and return the chisquare of this histogram with respect to a function
 The chisquare is computed by weighting each histogram point by the bin error
 By default the full range of the histogram is used.
 Use option "R" for restricting the chisquare calculation to the given range of the function
 Remove all the content from the underflow and overflow bins, without changing the number of entries
 After calling this method, every undeflow and overflow bins will have content 0.0
 The Sumw2 is also cleared, since there is no more content in the bins
  Compute integral (cumulative sum of bins)
  The result stored in fIntegral is used by the GetRandom functions.
  This function is automatically called by GetRandom when the fIntegral
  array does not exist or when the number of entries in the histogram
  has changed since the previous call to GetRandom.
  The resulting integral is normalized to 1
  If the routine is called with the onlyPositive flag set an error will
  be produced in case of negative bin content and a NaN value returned
  Return a pointer to the array of bins integral.
  if the pointer fIntegral is null, TH1::ComputeIntegral is called
 The array dimension is the number of bins in the histograms
 including underflow and overflow (fNCells)
 the last value integral[fNCells] is set to the number of entries of
 the histogram
  Return a pointer to an histogram containing the cumulative The
  cumulative can be computed both in the forward (default) or backward
  direction; the name of the new histogram is constructed from
  the name of this histogram with the suffix suffix appended.

 The cumulative distribution is formed by filling each bin of the
 resulting histogram with the sum of that bin and all previous
 (forward == kTRUE) or following (forward = kFALSE) bins.

 note: while cumulative distributions make sense in one dimension, you
 may not be getting what you expect in more than 1D because the concept
 of a cumulative distribution is much trickier to define; make sure you
 understand the order of summation before you use this method with
 histograms of dimension >= 2.
 Perform the automatic addition of the histogram to the given directory

 Note this function is called in place when the semantic requires
 this object to be added to a directory (I.e. when being read from
 a TKey or being Cloned)
 Compute distance from point px,py to a line.

     Compute the closest distance of approach from point px,py to elements
     of an histogram.
     The distance is computed in pixels units.

     Algorithm:
     Currently, this simple model computes the distance from the mouse
     to the histogram contour only.
 Performs the operation: this = this/(c1*f1)
 if errors are defined (see TH1::Sumw2), errors are also recalculated.

 Only bins inside the function range are recomputed.
 IMPORTANT NOTE: If you intend to use the errors of this histogram later
 you should call Sumw2 before making this operation.
 This is particularly important if you fit the histogram after TH1::Divide

 The function return kFALSE if the divide operation failed
 Divide this histogram by h1.

   this = this/h1
   if errors are defined (see TH1::Sumw2), errors are also recalculated.
   Note that if h1 has Sumw2 set, Sumw2 is automatically called for this
   if not already set.
   The resulting errors are calculated assuming uncorrelated histograms.
   See the other TH1::Divide that gives the possibility to optionally
   compute binomial errors.

 IMPORTANT NOTE: If you intend to use the errors of this histogram later
 you should call Sumw2 before making this operation.
 This is particularly important if you fit the histogram after TH1::Scale

 The function return kFALSE if the divide operation failed
 Replace contents of this histogram by the division of h1 by h2.

   this = c1*h1/(c2*h2)

   if errors are defined (see TH1::Sumw2), errors are also recalculated
   Note that if h1 or h2 have Sumw2 set, Sumw2 is automatically called for this
   if not already set.
   The resulting errors are calculated assuming uncorrelated histograms.
   However, if option ="B" is specified, Binomial errors are computed.
   In this case c1 and c2 do not make real sense and they are ignored.

 IMPORTANT NOTE: If you intend to use the errors of this histogram later
 you should call Sumw2 before making this operation.
 This is particularly important if you fit the histogram after TH1::Divide

  Please note also that in the binomial case errors are calculated using standard
  binomial statistics, which means when b1 = b2, the error is zero.
  If you prefer to have efficiency errors not going to zero when the efficiency is 1, you must
  use the function TGraphAsymmErrors::BayesDivide, which will return an asymmetric and non-zero lower
  error for the case b1=b2.

 The function return kFALSE if the divide operation failed
 Draw this histogram with options.

 Histograms are drawn via the THistPainter class. Each histogram has
 a pointer to its own painter (to be usable in a multithreaded program).
 The same histogram can be drawn with different options in different pads.
 When an histogram drawn in a pad is deleted, the histogram is
 automatically removed from the pad or pads where it was drawn.
 If an histogram is drawn in a pad, then filled again, the new status
 of the histogram will be automatically shown in the pad next time
 the pad is updated. One does not need to redraw the histogram.
 To draw the current version of an histogram in a pad, one can use
      h->DrawCopy();
 This makes a clone of the histogram. Once the clone is drawn, the original
 histogram may be modified or deleted without affecting the aspect of the
 clone.
 By default, TH1::Draw clears the current pad.

 One can use TH1::SetMaximum and TH1::SetMinimum to force a particular
 value for the maximum or the minimum scale on the plot.

 TH1::UseCurrentStyle can be used to change all histogram graphics
 attributes to correspond to the current selected style.
 This function must be called for each histogram.
 In case one reads and draws many histograms from a file, one can force
 the histograms to inherit automatically the current graphics style
 by calling before gROOT->ForceStyle();

 See the THistPainter class for a description of all the drawing options.
 Copy this histogram and Draw in the current pad.

     Once the histogram is drawn into the pad, any further modification
     using graphics input will be made on the copy of the histogram,
     and not to the original object.
     By default a postfix "_copy" is added to the histogram name. Pass an empty postfix in case
     you want to draw an histogram with the same name

     See Draw for the list of options
  Draw a normalized copy of this histogram.

  A clone of this histogram is normalized to norm and drawn with option.
  A pointer to the normalized histogram is returned.
  The contents of the histogram copy are scaled such that the new
  sum of weights (excluding under and overflow) is equal to norm.
  Note that the returned normalized histogram is not added to the list
  of histograms in the current directory in memory.
  It is the user's responsability to delete this histogram.
  The kCanDelete bit is set for the returned object. If a pad containing
  this copy is cleared, the histogram will be automatically deleted.

     See Draw for the list of options
 Display a panel with all histogram drawing options.

      See class TDrawPanelHist for example
 Evaluate function f1 at the center of bins of this histogram.

     If option "R" is specified, the function is evaluated only
     for the bins included in the function range.
     If option "A" is specified, the value of the function is added to the
     existing bin contents
     If option "S" is specified, the value of the function is used to
     generate a value, distributed according to the Poisson
     distribution, with f1 as the mean.
 Execute action corresponding to one event.

     This member function is called when a histogram is clicked with the locator

     If Left button clicked on the bin top value, then the content of this bin
     is modified according to the new position of the mouse when it is released.
 This function allows to do discrete Fourier transforms of TH1 and TH2.
 Available transform types and flags are described below.

 To extract more information about the transform, use the function
  TVirtualFFT::GetCurrentTransform() to get a pointer to the current
  transform object.

 Parameters:
  1st - histogram for the output. If a null pointer is passed, a new histogram is created
  and returned, otherwise, the provided histogram is used and should be big enough

  Options: option parameters consists of 3 parts:
    - option on what to return
   "RE" - returns a histogram of the real part of the output
   "IM" - returns a histogram of the imaginary part of the output
   "MAG"- returns a histogram of the magnitude of the output
   "PH" - returns a histogram of the phase of the output

    - option of transform type
   "R2C"  - real to complex transforms - default
   "R2HC" - real to halfcomplex (special format of storing output data,
          results the same as for R2C)
   "DHT" - discrete Hartley transform
         real to real transforms (sine and cosine):
   "R2R_0", "R2R_1", "R2R_2", "R2R_3" - discrete cosine transforms of types I-IV
   "R2R_4", "R2R_5", "R2R_6", "R2R_7" - discrete sine transforms of types I-IV
    To specify the type of each dimension of a 2-dimensional real to real
    transform, use options of form "R2R_XX", for example, "R2R_02" for a transform,
    which is of type "R2R_0" in 1st dimension and  "R2R_2" in the 2nd.

    - option of transform flag
    "ES" (from "estimate") - no time in preparing the transform, but probably sub-optimal
       performance
    "M" (from "measure")   - some time spend in finding the optimal way to do the transform
    "P" (from "patient")   - more time spend in finding the optimal way to do the transform
    "EX" (from "exhaustive") - the most optimal way is found
     This option should be chosen depending on how many transforms of the same size and
     type are going to be done. Planning is only done once, for the first transform of this
     size and type. Default is "ES".
   Examples of valid options: "Mag R2C M" "Re R2R_11" "Im R2C ES" "PH R2HC EX"
 Increment bin with abscissa X by 1.

    if x is less than the low-edge of the first bin, the Underflow bin is incremented
    if x is greater than the upper edge of last bin, the Overflow bin is incremented

    If the storage of the sum of squares of weights has been triggered,
    via the function Sumw2, then the sum of the squares of weights is incremented
    by 1 in the bin corresponding to x.

    The function returns the corresponding bin number which has its content incremented by 1
 Increment bin with abscissa X with a weight w.

    if x is less than the low-edge of the first bin, the Underflow bin is incremented
    if x is greater than the upper edge of last bin, the Overflow bin is incremented

    If the weight is not equal to 1, the storage of the sum of squares of
    weights is automatically triggered and the sum of the squares of weights is incremented
    by w^2 in the bin corresponding to x.

    The function returns the corresponding bin number which has its content incremented by w
 Increment bin with namex with a weight w

 if x is less than the low-edge of the first bin, the Underflow bin is incremented
 if x is greater than the upper edge of last bin, the Overflow bin is incremented

 If the weight is not equal to 1, the storage of the sum of squares of
 weights is automatically triggered and the sum of the squares of weights is incremented
 by w^2 in the bin corresponding to x.

 The function returns the corresponding bin number which has its content
 incremented by w
 Fill this histogram with an array x and weights w.

    ntimes:  number of entries in arrays x and w (array size must be ntimes*stride)
    x:       array of values to be histogrammed
    w:       array of weighs
    stride:  step size through arrays x and w

    If the weight is not equal to 1, the storage of the sum of squares of
    weights is automatically triggered and the sum of the squares of weights is incremented
    by w^2 in the bin corresponding to x.
    if w is NULL each entry is assumed a weight=1
 internal method to fill histogram content from a vector
 called directly by TH1::BufferEmpty
 Fill histogram following distribution in function fname.

      The distribution contained in the function fname (TF1) is integrated
      over the channel contents for the bin range of this histogram.
      It is normalized to 1.
      Getting one random number implies:
        - Generating a random number between 0 and 1 (say r1)
        - Look in which bin in the normalized integral r1 corresponds to
        - Fill histogram channel
      ntimes random numbers are generated

     One can also call TF1::GetRandom to get a random variate from a function.
 Fill histogram following distribution in histogram h.

      The distribution contained in the histogram h (TH1) is integrated
      over the channel contents for the bin range of this histogram.
      It is normalized to 1.
      Getting one random number implies:
        - Generating a random number between 0 and 1 (say r1)
        - Look in which bin in the normalized integral r1 corresponds to
        - Fill histogram channel
      ntimes random numbers are generated

    SPECIAL CASE when the target histogram has the same binning as the source.
   in this case we simply use a poisson distribution where
   the mean value per bin = bincontent/integral.
   Return Global bin number corresponding to x,y,z

      2-D and 3-D histograms are represented with a one dimensional
      structure. This has the advantage that all existing functions, such as
      GetBinContent, GetBinError, GetBinFunction work for all dimensions.
      This function tries to extend the axis if the given point belongs to an
       under-/overflow bin AND if CanExtendAllAxes() is true.
     See also TH1::GetBin, TAxis::FindBin and TAxis::FindFixBin
   Return Global bin number corresponding to x,y,z.

      2-D and 3-D histograms are represented with a one dimensional
      structure. This has the advantage that all existing functions, such as
      GetBinContent, GetBinError, GetBinFunction work for all dimensions.
      This function DOES NOT try to extend the axis if the given point belongs
      to an under-/overflow bin.
     See also TH1::GetBin, TAxis::FindBin and TAxis::FindFixBin
find first bin with content > threshold for axis (1=x, 2=y, 3=z)
if no bins with content > threshold is found the function returns -1.
find last bin with content > threshold for axis (1=x, 2=y, 3=z)
if no bins with content > threshold is found the function returns -1.
 Fit histogram with function fname.

      fname is the name of an already predefined function created by TF1 or TF2
      Predefined functions such as gaus, expo and poln are automatically
      created by ROOT.
      fname can also be a formula, accepted by the linear fitter (linear parts divided
      by "++" sign), for example "x++sin(x)" for fitting "[0]*x+[1]*sin(x)"

  This function finds a pointer to the TF1 object with name fname
  and calls TH1::Fit(TF1 *f1,...)
 Fit histogram with function f1.

      Fit this histogram with function f1.

      The list of fit options is given in parameter option.
         option = "W"  Set all weights to 1 for non empty bins; ignore error bars
                = "WW" Set all weights to 1 including empty bins; ignore error bars
                = "I"  Use integral of function in bin, normalized by the bin volume,
                       instead of value at bin center
                = "L"  Use Loglikelihood method (default is chisquare method)
                = "WL" Use Loglikelihood method and bin contents are not integer,
                       i.e. histogram is weighted (must have Sumw2() set)
                = "U"  Use a User specified fitting algorithm (via SetFCN)
                = "Q"  Quiet mode (minimum printing)
                = "V"  Verbose mode (default is between Q and V)
                = "E"  Perform better Errors estimation using Minos technique
                = "B"  User defined parameter settings are used for predefined functions
                       like "gaus", "expo", "poln", "landau".
                       Use this option when you want to fix one or more parameters for these functions.
                = "M"  More. Improve fit results.
                       It uses the IMPROVE command of TMinuit (see TMinuit::mnimpr).
                       This algorithm attempts to improve the found local minimum by searching for a
                       better one.
                = "R"  Use the Range specified in the function range
                = "N"  Do not store the graphics function, do not draw
                = "0"  Do not plot the result of the fit. By default the fitted function
                       is drawn unless the option"N" above is specified.
                = "+"  Add this new fitted function to the list of fitted functions
                       (by default, any previous function is deleted)
                = "C"  In case of linear fitting, don't calculate the chisquare
                       (saves time)
                = "F"  If fitting a polN, switch to minuit fitter
                = "S"  The result of the fit is returned in the TFitResultPtr
                       (see below Access to the Fit Result)

      When the fit is drawn (by default), the parameter goption may be used
      to specify a list of graphics options. See TH1::Draw for a complete
      list of these options.

      In order to use the Range option, one must first create a function
      with the expression to be fitted. For example, if your histogram
      has a defined range between -4 and 4 and you want to fit a gaussian
      only in the interval 1 to 3, you can do:
           TF1 *f1 = new TF1("f1", "gaus", 1, 3);
           histo->Fit("f1", "R");

      Setting initial conditions

      Parameters must be initialized before invoking the Fit function.
      The setting of the parameter initial values is automatic for the
      predefined functions : poln, expo, gaus, landau. One can however disable
      this automatic computation by specifying the option "B".
      Note that if a predefined function is defined with an argument,
      eg, gaus(0), expo(1), you must specify the initial values for
      the parameters.
      You can specify boundary limits for some or all parameters via
           f1->SetParLimits(p_number, parmin, parmax);
      if parmin>=parmax, the parameter is fixed
      Note that you are not forced to fix the limits for all parameters.
      For example, if you fit a function with 6 parameters, you can do:
        func->SetParameters(0, 3.1, 1.e-6, -8, 0, 100);
        func->SetParLimits(3, -10, -4);
        func->FixParameter(4, 0);
        func->SetParLimits(5, 1, 1);
      With this setup, parameters 0->2 can vary freely
      Parameter 3 has boundaries [-10,-4] with initial value -8
      Parameter 4 is fixed to 0
      Parameter 5 is fixed to 100.
      When the lower limit and upper limit are equal, the parameter is fixed.
      However to fix a parameter to 0, one must call the FixParameter function.

      Note that option "I" gives better results but is slower.


     Changing the fitting objective function

     By default a chi square function is used for fitting. When option "L" (or "LL") is used
     a Poisson likelihood function (see note below) is used.
     The functions are defined in the header Fit/Chi2Func.h or Fit/PoissonLikelihoodFCN and they
     are implemented using the routines FitUtil::EvaluateChi2 or FitUtil::EvaluatePoissonLogL in
     the file math/mathcore/src/FitUtil.cxx.
     To specify a User defined fitting function, specify option "U" and
     call the following functions:
       TVirtualFitter::Fitter(myhist)->SetFCN(MyFittingFunction)
     where MyFittingFunction is of type:
     extern void MyFittingFunction(Int_t &npar, Double_t *gin, Double_t &f, Double_t *u, Int_t flag);

     Chi2 Fits

     By default a chi2 (least-square) fit is performed on the histogram. The so-called modified least-square method
     is used where the residual for each bin is computed using as error the observed value (the bin error)

     Chi2 = Sum{ ( y(i) - f (x(i) | p )/ e(i) )^2 }

     where y(i) is the bin content for each bin i, x(i) is the bin center and e(i) is the bin error (sqrt(y(i) for
     an un-weighted histogram. Bins with zero errors are excluded from the fit. See also later the note on the treatment of empty bins.
     When using option "I" the residual is computed not using the function value at the bin center, f (x(i) | p), but the integral
     of the function in the bin,   Integral{ f(x|p)dx } divided by the bin volume

     Likelihood Fits

     When using option "L" a likelihood fit is used instead of the default chi2 square fit.
     The likelihood is built assuming a Poisson probability density function for each bin.
     The negative log-likelihood to be minimized is
      NLL = Sum{ log Poisson( y(i) |{ f(x(i) | p ) ) }
     The exact likelihood used is the Poisson likelihood described in this paper:
     S. Baker and R. D. Cousins, “Clarification of the use of chi-square and likelihood functions in fits to histograms,”
     Nucl. Instrum. Meth. 221 (1984) 437.
     This method can then be used only when the bin content represents counts (i.e. errors are sqrt(N) ).
     The likelihood method has the advantage of treating correctly bins with low statistics. In case of high
     statistics/bin the distribution of the bin content becomes a normal distribution and the likelihood and chi2 fit
     give the same result.
     The likelihood method, although a bit slower, it is therefore the recommended method in case of low
     bin statistics, where the chi2 method may give incorrect results, in particular when there are
     several empty bins (see also below).
     In case of a weighted histogram, it is possible to perform a likelihood fit by using the
     option "WL". Note a weighted histogram is an histogram which has been filled with weights and it
     contains the sum of the weight square ( TH1::Sumw2() has been called). The bin error for a weighted
     histogram is the square root of the sum of the weight square.

     Treatment of Empty Bins


     Empty bins, which have the content equal to zero AND error equal to zero,
     are excluded by default from the chisquare fit, but they are considered in the likelihood fit.
     since they affect the likelihood if the function value in these bins is not negligible.
     When using option "WW" these bins will be considered in the chi2 fit with an error of 1.
     Note that if the histogram is having bins with zero content and non zero-errors they are considered as
     any other bins in the fit. Instead bins with zero error and non-zero content are excluded in the chi2 fit.
     A likelihood fit should also not be peformed on such an histogram, since we are assuming a wrong pdf for each bin.
     In general, one should not fit an histogram with non-empty bins and zero errors, apart if all the bins have zero errors.
     In this case one could use the option "w", which gives a weight=1 for each bin (unweighted least-square fit).

     Fitting a histogram of dimension N with a function of dimension N-1

     It is possible to fit a TH2 with a TF1 or a TH3 with a TF2.
     In this case the option "Integral" is not allowed and each cell has
     equal weight.

     Associated functions

     One or more object (typically a TF1*) can be added to the list
     of functions (fFunctions) associated to each histogram.
     When TH1::Fit is invoked, the fitted function is added to this list.
     Given an histogram h, one can retrieve an associated function
     with:  TF1 *myfunc = h->GetFunction("myfunc");

     Access to the fit result

     The function returns a TFitResultPtr which can hold a  pointer to a TFitResult object.
     By default the TFitResultPtr contains only the status of the fit which is return by an
     automatic conversion of the TFitResultPtr to an integer. One can write in this case directly:
     Int_t fitStatus =  h->Fit(myFunc)

     If the option "S" is instead used, TFitResultPtr contains the TFitResult and behaves as a smart
     pointer to it. For example one can do:
     TFitResultPtr r = h->Fit(myFunc,"S");
     TMatrixDSym cov = r->GetCovarianceMatrix();  //  to access the covariance matrix
     Double_t chi2   = r->Chi2(); // to retrieve the fit chi2
     Double_t par0   = r->Parameter(0); // retrieve the value for the parameter 0
     Double_t err0   = r->ParError(0); // retrieve the error for the parameter 0
     r->Print("V");     // print full information of fit including covariance matrix
     r->Write();        // store the result in a file

     The fit parameters, error and chi2 (but not covariance matrix) can be retrieved also
     from the fitted function.
     If the histogram is made persistent, the list of
     associated functions is also persistent. Given a pointer (see above)
     to an associated function myfunc, one can retrieve the function/fit
     parameters with calls such as:
       Double_t chi2 = myfunc->GetChisquare();
       Double_t par0 = myfunc->GetParameter(0); //value of 1st parameter
       Double_t err0 = myfunc->GetParError(0);  //error on first parameter

     Access to the fit status

     The status of the fit can be obtained converting the TFitResultPtr to an integer
     independently if the fit option "S" is used or not:
     TFitResultPtr r = h->Fit(myFunc,opt);
     Int_t fitStatus = r;

     The fitStatus is 0 if the fit is OK (i.e no error occurred).
     The value of the fit status code is negative in case of an error not connected with the
     minimization procedure, for example  when a wrong function is used.
     Otherwise the return value is the one returned from the minimization procedure.
     When TMinuit (default case) or Minuit2 are used as minimizer the status returned is :
     fitStatus =  migradResult + 10*minosResult + 100*hesseResult + 1000*improveResult.
     TMinuit will return 0 (for migrad, minos, hesse or improve) in case of success and 4 in
     case of error (see the documentation of TMinuit::mnexcm). So for example, for an error
     only in Minos but not in Migrad a fitStatus of 40 will be returned.
     Minuit2 will return also 0 in case of success and different values in migrad minos or
     hesse depending on the error. See in this case the documentation of
     Minuit2Minimizer::Minimize for the migradResult, Minuit2Minimizer::GetMinosError for the
     minosResult and Minuit2Minimizer::Hesse for the hesseResult.
     If other minimizers are used see their specific documentation for the status code returned.
     For example in the case of Fumili, for the status returned see TFumili::Minimize.

     Excluding points

     Use TF1::RejectPoint inside your fitting function to exclude points
     within a certain range from the fit. Example:
     Double_t fline(Double_t *x, Double_t *par)
     {
         if (x[0] > 2.5 && x[0] < 3.5) {
           TF1::RejectPoint();
           return 0;
        }
        return par[0] + par[1]*x[0];
     }

     void exclude() {
        TF1 *f1 = new TF1("f1", "[0] +[1]*x +gaus(2)", 0, 5);
        f1->SetParameters(6, -1,5, 3, 0.2);
        TH1F *h = new TH1F("h", "background + signal", 100, 0, 5);
        h->FillRandom("f1", 2000);
        TF1 *fline = new TF1("fline", fline, 0, 5, 2);
        fline->SetParameters(2, -1);
        h->Fit("fline", "l");
     }

     Warning when using the option "0"

     When selecting the option "0", the fitted function is added to
     the list of functions of the histogram, but it is not drawn.
     You can undo what you disabled in the following way:
       h.Fit("myFunction", "0"); // fit, store function but do not draw
       h.Draw(); function is not drawn
       const Int_t kNotDraw = 1<<9;
       h.GetFunction("myFunction")->ResetBit(kNotDraw);
       h.Draw();  // function is visible again

     Access to the Minimizer information during fitting

     This function calls, the ROOT::Fit::FitObject function implemented in HFitImpl.cxx
     which uses the ROOT::Fit::Fitter class. The Fitter class creates the objective fuction
     (e.g. chi2 or likelihood) and uses an implementation of the  Minimizer interface for minimizing
     the function.
     The default minimizer is Minuit (class TMinuitMinimizer which calls TMinuit).
     The default  can be set in the resource file in etc/system.rootrc. For example
     Root.Fitter:      Minuit2
     A different fitter can also be set via ROOT::Math::MinimizerOptions::SetDefaultMinimizer
     (or TVirtualFitter::SetDefaultFitter).
     For example ROOT::Math::MinimizerOptions::SetDefaultMinimizer("GSLMultiMin","BFGS");
     will set the usdage of the BFGS algorithm of the GSL multi-dimensional minimization
     (implemented in libMathMore). ROOT::Math::MinimizerOptions can be used also to set other
     default options, like maximum number of function calls, minimization tolerance or print
     level. See the documentation of this class.

     For fitting linear functions (containing the "++" sign" and polN functions,
     the linear fitter is automatically initialized.
 Return an histogram containing the asymmetry of this histogram with h2,
 where the asymmetry is defined as:

  Asymmetry = (h1 - h2)/(h1 + h2)  where h1 = this

  works for 1D, 2D, etc. histograms
  c2 is an optional argument that gives a relative weight between the two
  histograms, and dc2 is the error on this weight.  This is useful, for example,
  when forming an asymmetry between two histograms from 2 different data sets that
  need to be normalized to each other in some way.  The function calculates
  the errors asumming Poisson statistics on h1 and h2 (that is, dh = sqrt(h)).

  example:  assuming 'h1' and 'h2' are already filled

     h3 = h1->GetAsymmetry(h2)

  then 'h3' is created and filled with the asymmetry between 'h1' and 'h2';
  h1 and h2 are left intact.

  Note that it is the user's responsibility to manage the created histogram.
  The name of the returned histogram will be Asymmetry_nameOfh1-nameOfh2

  code proposed by Jason Seely (seely@mit.edu) and adapted by R.Brun

 clone the histograms so top and bottom will have the
 correct dimensions:
 Sumw2 just makes sure the errors will be computed properly
 when we form sums and ratios below.
 static function
 return the default buffer size for automatic histograms
 the parameter fgBufferSize may be changed via SetDefaultBufferSize
 static function
 return kTRUE if TH1::Sumw2 must be called when creating new histograms.
 see TH1::SetDefaultSumw2.
 number of effective entries of the histogram,
 neff = (Sum of weights )^2 / (Sum of weight^2 )
 In case of an unweighted histogram this number is equivalent to the
 number of entries of the histogram.
 For a weighted histogram, this number corresponds to the hypotetical number of unweighted entries
 a histogram would need to have the same statistical power as this weighted histogram.
 Note: The underflow/overflow are included if one has set the TH1::StatOverFlows flag
 and if the statistics has been computed at filling time.
 If a range is set in the histogram the number is computed from the given range.
   Redefines TObject::GetObjectInfo.
   Displays the histogram info (bin number, contents, integral up to bin
   corresponding to cursor position px,py
 return pointer to painter
 if painter does not exist, it is created
 Compute Quantiles for this histogram
 Quantile x_q of a probability distribution Function F is defined as

        F(x_q) = q with 0 <= q <= 1.

     For instance the median x_0.5 of a distribution is defined as that value
     of the random variable for which the distribution function equals 0.5:

        F(x_0.5) = Probability(x < x_0.5) = 0.5

  code from Eddy Offermann, Renaissance

 input parameters
   - this 1-d histogram (TH1F,D,etc). Could also be a TProfile
   - nprobSum maximum size of array q and size of array probSum (if given)
   - probSum array of positions where quantiles will be computed.
     if probSum is null, probSum will be computed internally and will
     have a size = number of bins + 1 in h. it will correspond to the
      quantiles calculated at the lowest edge of the histogram (quantile=0) and
     all the upper edges of the bins.
     if probSum is not null, it is assumed to contain at least nprobSum values.
  output
   - return value nq (<=nprobSum) with the number of quantiles computed
   - array q filled with nq quantiles

  Note that the Integral of the histogram is automatically recomputed
  if the number of entries is different of the number of entries when
  the integral was computed last time. In case you do not use the Fill
  functions to fill your histogram, but SetBinContent, you must call
  TH1::ComputeIntegral before calling this function.

  Getting quantiles q from two histograms and storing results in a TGraph,
   a so-called QQ-plot

     TGraph *gr = new TGraph(nprob);
     h1->GetQuantiles(nprob,gr->GetX());
     h2->GetQuantiles(nprob,gr->GetY());
     gr->Draw("alp");

 Example:
     void quantiles() {
        // demo for quantiles
        const Int_t nq = 20;
        TH1F *h = new TH1F("h","demo quantiles",100,-3,3);
        h->FillRandom("gaus",5000);

        Double_t xq[nq];  // position where to compute the quantiles in [0,1]
        Double_t yq[nq];  // array to contain the quantiles
        for (Int_t i=0;i<nq;i++) xq[i] = Float_t(i+1)/nq;
        h->GetQuantiles(nq,yq,xq);

        //show the original histogram in the top pad
        TCanvas *c1 = new TCanvas("c1","demo quantiles",10,10,700,900);
        c1->Divide(1,2);
        c1->cd(1);
        h->Draw();

        // show the quantiles in the bottom pad
        c1->cd(2);
        gPad->SetGrid();
        TGraph *gr = new TGraph(nq,xq,yq);
        gr->SetMarkerStyle(21);
        gr->Draw("alp");
     }
Decode string choptin and fill fitOption structure.
 Return Global bin number corresponding to binx,y,z.

      2-D and 3-D histograms are represented with a one dimensional
      structure.
      This has the advantage that all existing functions, such as
        GetBinContent, GetBinError, GetBinFunction work for all dimensions.

     In case of a TH1x, returns binx directly.
     see TH1::GetBinXYZ for the inverse transformation.

      Convention for numbering bins

      For all histogram types: nbins, xlow, xup
        bin = 0;       underflow bin
        bin = 1;       first bin with low-edge xlow INCLUDED
        bin = nbins;   last bin with upper-edge xup EXCLUDED
        bin = nbins+1; overflow bin
      In case of 2-D or 3-D histograms, a "global bin" number is defined.
      For example, assuming a 3-D histogram with binx,biny,binz, the function
        Int_t bin = h->GetBin(binx,biny,binz);
      returns a global/linearized bin number. This global bin is useful
      to access the bin information independently of the dimension.
 return a random number distributed according the histogram bin contents.
 This function checks if the bins integral exists. If not, the integral
 is evaluated, normalized to one.
 The integral is automatically recomputed if the number of entries
 is not the same then when the integral was computed.
 NB Only valid for 1-d histograms. Use GetRandom2 or 3 otherwise.
 If the histogram has a bin with negative content a NaN is returned
 Return content of bin number bin.

 Implemented in TH1C,S,F,D

      Convention for numbering bins

      For all histogram types: nbins, xlow, xup
        bin = 0;       underflow bin
        bin = 1;       first bin with low-edge xlow INCLUDED
        bin = nbins;   last bin with upper-edge xup EXCLUDED
        bin = nbins+1; overflow bin
      In case of 2-D or 3-D histograms, a "global bin" number is defined.
      For example, assuming a 3-D histogram with binx,biny,binz, the function
        Int_t bin = h->GetBin(binx,biny,binz);
      returns a global/linearized bin number. This global bin is useful
      to access the bin information independently of the dimension.
 compute first binx in the range [firstx,lastx] for which
 diff = abs(bin_content-c) <= maxdiff
 In case several bins in the specified range with diff=0 are found
 the first bin found is returned in binx.
 In case several bins in the specified range satisfy diff <=maxdiff
 the bin with the smallest difference is returned in binx.
 In all cases the function returns the smallest difference.

 NOTE1: if firstx <= 0, firstx is set to bin 1
        if (lastx < firstx then firstx is set to the number of bins
        ie if firstx=0 and lastx=0 (default) the search is on all bins.
 NOTE2: if maxdiff=0 (default), the first bin with content=c is returned.
 Given a point x, approximates the value via linear interpolation
 based on the two nearest bin centers
 Andy Mastbaum 10/21/08
 Reduce the number of bins for the axis passed in the option to the number of bins having a label.
 The method will remove only the extra bins existing after the last "labeled" bin.
 Note that if there are "un-labeled" bins present between "labeled" bins they will not be removed
  Set option(s) to draw axis with labels
  option = "a" sort by alphabetic order
         = ">" sort by decreasing values
         = "<" sort by increasing values
         = "h" draw labels horizontal
         = "v" draw labels vertical
         = "u" draw labels up (end of label right adjusted)
         = "d" draw labels down (start of label left adjusted)
 Finds new limits for the axis for the Merge function.
 returns false if the limits are incompatible
 Add all histograms in the collection to this histogram.
 This function computes the min/max for the x axis,
 compute a new number of bins, if necessary,
 add bin contents, errors and statistics.
 If all histograms have bin labels, bins with identical labels
 will be merged, no matter what their order is.
 If overflows are present and limits are different the function will fail.
 The function returns the total number of entries in the result histogram
 if the merge is successful, -1 otherwise.

 IMPORTANT remark. The axis x may have different number
 of bins and different limits, BUT the largest bin width must be
 a multiple of the smallest bin width and the upper limit must also
 be a multiple of the bin width.
 Example:
 void atest() {
    TH1F *h1 = new TH1F("h1","h1",110,-110,0);
    TH1F *h2 = new TH1F("h2","h2",220,0,110);
    TH1F *h3 = new TH1F("h3","h3",330,-55,55);
    TRandom r;
    for (Int_t i=0;i<10000;i++) {
       h1->Fill(r.Gaus(-55,10));
       h2->Fill(r.Gaus(55,10));
       h3->Fill(r.Gaus(0,10));
    }

    TList *list = new TList;
    list->Add(h1);
    list->Add(h2);
    list->Add(h3);
    TH1F *h = (TH1F*)h1->Clone("h");
    h->Reset();
    h->Merge(list);
    h->Draw();
 }
 Performs the operation: this = this*c1*f1
 if errors are defined (see TH1::Sumw2), errors are also recalculated.

 Only bins inside the function range are recomputed.
 IMPORTANT NOTE: If you intend to use the errors of this histogram later
 you should call Sumw2 before making this operation.
 This is particularly important if you fit the histogram after TH1::Multiply

 The function return kFALSE if the Multiply operation failed
 Multiply this histogram by h1.

   this = this*h1

   If errors of this are available (TH1::Sumw2), errors are recalculated.
   Note that if h1 has Sumw2 set, Sumw2 is automatically called for this
   if not already set.

 IMPORTANT NOTE: If you intend to use the errors of this histogram later
 you should call Sumw2 before making this operation.
 This is particularly important if you fit the histogram after TH1::Multiply

 The function return kFALSE if the Multiply operation failed
 Replace contents of this histogram by multiplication of h1 by h2.

   this = (c1*h1)*(c2*h2)

   If errors of this are available (TH1::Sumw2), errors are recalculated.
   Note that if h1 or h2 have Sumw2 set, Sumw2 is automatically called for this
   if not already set.

 IMPORTANT NOTE: If you intend to use the errors of this histogram later
 you should call Sumw2 before making this operation.
 This is particularly important if you fit the histogram after TH1::Multiply

 The function return kFALSE if the Multiply operation failed
   Rebin this histogram

  -case 1  xbins=0
   If newname is blank (default), the current histogram is modified and
   a pointer to it is returned.

   If newname is not blank, the current histogram is not modified, and a
   new histogram is returned which is a Clone of the current histogram
   with its name set to newname.

   The parameter ngroup indicates how many bins of this have to be merged
   into one bin of the result.

   If the original histogram has errors stored (via Sumw2), the resulting
   histograms has new errors correctly calculated.

   examples: if h1 is an existing TH1F histogram with 100 bins
     h1->Rebin();  //merges two bins in one in h1: previous contents of h1 are lost
     h1->Rebin(5); //merges five bins in one in h1
     TH1F *hnew = h1->Rebin(5,"hnew"); // creates a new histogram hnew
                                       // merging 5 bins of h1 in one bin

   NOTE:  If ngroup is not an exact divider of the number of bins,
          the top limit of the rebinned histogram is reduced
          to the upper edge of the last bin that can make a complete
          group. The remaining bins are added to the overflow bin.
          Statistics will be recomputed from the new bin contents.

  -case 2  xbins!=0
   A new histogram is created (you should specify newname).
   The parameter ngroup is the number of variable size bins in the created histogram.
   The array xbins must contain ngroup+1 elements that represent the low-edges
   of the bins.
   If the original histogram has errors stored (via Sumw2), the resulting
   histograms has new errors correctly calculated.

   NOTE:  The bin edges specified in xbins should correspond to bin edges
          in the original histogram. If a bin edge in the new histogram is
          in the middle of a bin in the original histogram, all entries in
          the split bin in the original histogram will be transfered to the
          lower of the two possible bins in the new histogram. This is
          probably not what you want.

   examples: if h1 is an existing TH1F histogram with 100 bins
     Double_t xbins[25] = {...} array of low-edges (xbins[25] is the upper edge of last bin
     h1->Rebin(24,"hnew",xbins);  //creates a new variable bin size histogram hnew
 finds new limits for the axis so that *point* is within the range and
 the limits are compatible with the previous ones (see TH1::Merge).
 new limits are put into *newMin* and *newMax* variables.
 axis - axis whose limits are to be recomputed
 point - point that should fit within the new axis limits
 newMin - new minimum will be stored here
 newMax - new maximum will be stored here.
 false if failed (e.g. if the initial axis limits are wrong
 or the new range is more than 2^64 times the old one).
 Histogram is resized along axis such that x is in the axis range.
 The new axis limits are recomputed by doubling iteratively
 the current axis range until the specified value x is within the limits.
 The algorithm makes a copy of the histogram, then loops on all bins
 of the old histogram to fill the extended histogram.
 Takes into account errors (Sumw2) if any.
 The algorithm works for 1-d, 2-D and 3-D histograms.
 The axis must be extendable before invoking this function.
 Ex: h->GetXaxis()->SetCanExtend(kTRUE);
 Multiply this histogram by a constant c1.

   this = c1*this

 Note that both contents and errors(if any) are scaled.
 This function uses the services of TH1::Add

 IMPORTANT NOTE: If you intend to use the errors of this histogram later
 you should call Sumw2 before making this operation.
 This is particularly important if you fit the histogram after TH1::Scale

 One can scale an histogram such that the bins integral is equal to
 the normalization parameter via TH1::Scale(Double_t norm), where norm
 is the desired normalization divided by the integral of the histogram.

 If option contains "width" the bin contents and errors are divided
 by the bin width.
 make the histogram axes extendable / not extendable according to the bit mask
 returns the previous bit mask specifying which axes are extendable
 static function to set the default buffer size for automatic histograms.
 When an histogram is created with one of its axis lower limit greater
 or equal to its upper limit, the function SetBuffer is automatically
 called with the default buffer size.
 Change (i.e. set) the title

   if title is in the form "stringt;stringx;stringy;stringz"
   the histogram title is set to stringt, the x axis title to stringx,
   the y axis title to stringy, and the z axis title to stringz.
   To insert the character ";" in one of the titles, one should use "#;"
   or "#semicolon".
 smooth array xx, translation of Hbook routine hsmoof.F
 based on algorithm 353QH twice presented by J. Friedman
 in Proc.of the 1974 CERN School of Computing, Norway, 11-24 August, 1974.
 Smooth bin contents of this histogram.
 if option contains "R" smoothing is applied only to the bins
 defined in the X axis range (default is to smooth all bins)
 Bin contents are replaced by their smooth values.
 Errors (if any) are not modified.
 the smoothing procedure is repeated ntimes (default=1)
 Print some global quantities for this histogram.

  If option "base" is given, number of bins and ranges are also printed
  If option "range" is given, bin contents and errors are also printed
                     for all bins in the current range (default 1-->nbins)
  If option "all" is given, bin contents and errors are also printed
                     for all bins including under and overflows.
Using the current bin info, recompute the arrays for contents and errors
Save primitive as a C++ statement(s) on output stream out
 helper function for the SavePrimitive functions from TH1
 or classes derived from TH1, eg TProfile, TProfile2D.
  For axis = 1,2 or 3 returns the mean value of the histogram along
  X,Y or Z axis.
  For axis = 11, 12, 13 returns the standard error of the mean value
  of the histogram along X, Y or Z axis

  Note that the mean value/RMS is computed using the bins in the currently
  defined range (see TAxis::SetRange). By default the range includes
  all bins from 1 to nbins included, excluding underflows and overflows.
  To force the underflows and overflows in the computation, one must
  call the static function TH1::StatOverflows(kTRUE) before filling
  the histogram.

 Return mean value of this histogram along the X axis.

  Note that the mean value/RMS is computed using the bins in the currently
  defined range (see TAxis::SetRange). By default the range includes
  all bins from 1 to nbins included, excluding underflows and overflows.
  To force the underflows and overflows in the computation, one must
  call the static function TH1::StatOverflows(kTRUE) before filling
  the histogram.
 Return standard error of mean of this histogram along the X axis.

  Note that the mean value/RMS is computed using the bins in the currently
  defined range (see TAxis::SetRange). By default the range includes
  all bins from 1 to nbins included, excluding underflows and overflows.
  To force the underflows and overflows in the computation, one must
  call the static function TH1::StatOverflows(kTRUE) before filling
  the histogram.
  Also note, that although the definition of standard error doesn't include the
  assumption of normality, many uses of this feature implicitly assume it.
  For axis = 1,2 or 3 returns the Sigma value of the histogram along
  X, Y or Z axis
  For axis = 11, 12 or 13 returns the error of RMS estimation along
  X, Y or Z axis for Normal distribution

     Note that the mean value/sigma is computed using the bins in the currently
  defined range (see TAxis::SetRange). By default the range includes
  all bins from 1 to nbins included, excluding underflows and overflows.
  To force the underflows and overflows in the computation, one must
  call the static function TH1::StatOverflows(kTRUE) before filling
  the histogram.
  Note that this function returns the Standard Deviation (Sigma)
  of the distribution (not RMS).
  The Sigma estimate is computed as Sqrt((1/N)*(Sum(x_i-x_mean)^2))
  The name "RMS" was introduced many years ago (Hbook/PAW times).
  We kept the name for continuity.
  Return error of RMS estimation for Normal distribution

  Note that the mean value/RMS is computed using the bins in the currently
  defined range (see TAxis::SetRange). By default the range includes
  all bins from 1 to nbins included, excluding underflows and overflows.
  To force the underflows and overflows in the computation, one must
  call the static function TH1::StatOverflows(kTRUE) before filling
  the histogram.
  Value returned is standard deviation of sample standard deviation.
  Note that it is an approximated value which is valid only in the case that the
  original data distribution is Normal. The correct one would require
  the 4-th momentum value, which cannot be accurately estimated from an histogram since
  the x-information for all entries is not kept.
For axis = 1, 2 or 3 returns skewness of the histogram along x, y or z axis.
For axis = 11, 12 or 13 returns the approximate standard error of skewness
of the histogram along x, y or z axis
Note, that since third and fourth moment are not calculated
at the fill time, skewness and its standard error are computed bin by bin
For axis =1, 2 or 3 returns kurtosis of the histogram along x, y or z axis.
Kurtosis(gaussian(0, 1)) = 0.
For axis =11, 12 or 13 returns the approximate standard error of kurtosis
of the histogram along x, y or z axis
Note, that since third and fourth moment are not calculated
at the fill time, kurtosis and its standard error are computed bin by bin
 fill the array stats from the contents of this histogram
 The array stats must be correctly dimensioned in the calling program.
 stats[0] = sumw
 stats[1] = sumw2
 stats[2] = sumwx
 stats[3] = sumwx2

 If no axis-subrange is specified (via TAxis::SetRange), the array stats
 is simply a copy of the statistics quantities computed at filling time.
 If a sub-range is specified, the function recomputes these quantities
 from the bin contents in the current axis range.

  Note that the mean value/RMS is computed using the bins in the currently
  defined range (see TAxis::SetRange). By default the range includes
  all bins from 1 to nbins included, excluding underflows and overflows.
  To force the underflows and overflows in the computation, one must
  call the static function TH1::StatOverflows(kTRUE) before filling
  the histogram.
 Reset the statistics including the number of entries
 and replace with values calculates from bin content
 The number of entries is set to the total bin content or (in case of weighted histogram)
 to number of effective entries
Return integral of bin contents. Only bins in the bins range are considered.
 By default the integral is computed as the sum of bin contents in the range.
 if option "width" is specified, the integral is the sum of
 the bin contents multiplied by the bin width in x.
Return integral of bin contents in range [binx1,binx2]
 By default the integral is computed as the sum of bin contents in the range.
 if option "width" is specified, the integral is the sum of
 the bin contents multiplied by the bin width in x.
Return integral of bin contents in range [binx1,binx2] and its error
 By default the integral is computed as the sum of bin contents in the range.
 if option "width" is specified, the integral is the sum of
 the bin contents multiplied by the bin width in x.
 the error is computed using error propagation from the bin errors assumming that
 all the bins are uncorrelated
 internal function compute integral and optionally the error  between the limits
 specified by the bin number values working for all histograms (1D, 2D and 3D)
  Statistical test of compatibility in shape between
  this histogram and h2, using the Anderson-Darling 2 sample test.
  The AD 2 sample test formula are derived from the paper
  F.W Scholz, M.A. Stephens "k-Sample Anderson-Darling Test".
  The test is implemented in root in the ROOT::Math::GoFTest class
  It is the same formula ( (6) in the paper), and also shown in this preprint
  http://arxiv.org/pdf/0804.0380v1.pdf
  Binned data are considered as un-binned data
   with identical observation happening in the bin center.

     option is a character string to specify options
         "D" Put out a line of "Debug" printout
         "T" Return the normalized A-D test statistic

  Note1: Underflow and overflow are not considered in the test
  Note2:  The test works only for un-weighted histogram (i.e. representing counts)
  Note3:  The histograms are not required to have the same X axis
  Note4:  The test works only for 1-dimensional histograms
Same funciton as above but returning also the test statistic value
  Statistical test of compatibility in shape between
  this histogram and h2, using Kolmogorov test.
  Note that the KolmogorovTest (KS) test should in theory be used only for unbinned data
  and not for binned data as in the case of the histogram (see NOTE 3 below).
  So, before using this method blindly, read the NOTE 3.


     Default: Ignore under- and overflow bins in comparison

     option is a character string to specify options
         "U" include Underflows in test  (also for 2-dim)
         "O" include Overflows     (also valid for 2-dim)
         "N" include comparison of normalizations
         "D" Put out a line of "Debug" printout
         "M" Return the Maximum Kolmogorov distance instead of prob
         "X" Run the pseudo experiments post-processor with the following procedure:
             make pseudoexperiments based on random values from the parent
             distribution and compare the KS distance of the pseudoexperiment
             to the parent distribution. Bin the KS distances in a histogram,
             and then take the integral of all the KS values above the value
             obtained from the original data to Monte Carlo distribution.
             The number of pseudo-experiments nEXPT is currently fixed at 1000.
             The function returns the integral.
             (thanks to Ben Kilminster to submit this procedure). Note that
             this option "X" is much slower.

   The returned function value is the probability of test
       (much less than one means NOT compatible)

  Code adapted by Rene Brun from original HBOOK routine HDIFF

  NOTE1
  A good description of the Kolmogorov test can be seen at:
    http://www.itl.nist.gov/div898/handbook/eda/section3/eda35g.htm

  NOTE2
  see also alternative function TH1::Chi2Test
  The Kolmogorov test is assumed to give better results than Chi2Test
  in case of histograms with low statistics.

  NOTE3 (Jan Conrad, Fred James)
  "The returned value PROB is calculated such that it will be
  uniformly distributed between zero and one for compatible histograms,
  provided the data are not binned (or the number of bins is very large
  compared with the number of events). Users who have access to unbinned
  data and wish exact confidence levels should therefore not put their data
  into histograms, but should call directly TMath::KolmogorovTest. On
  the other hand, since TH1 is a convenient way of collecting data and
  saving space, this function has been provided. However, the values of
  PROB for binned data will be shifted slightly higher than expected,
  depending on the effects of the binning. For example, when comparing two
  uniform distributions of 500 events in 100 bins, the values of PROB,
  instead of being exactly uniformly distributed between zero and one, have
  a mean value of about 0.56. We can apply a useful
  rule: As long as the bin width is small compared with any significant
  physical effect (for example the experimental resolution) then the binning
  cannot have an important effect. Therefore, we believe that for all
  practical purposes, the probability value PROB is calculated correctly
  provided the user is aware that:
     1. The value of PROB should not be expected to have exactly the correct
  distribution for binned data.
     2. The user is responsible for seeing to it that the bin widths are
  small compared with any physical phenomena of interest.
     3. The effect of binning (if any) is always to make the value of PROB
  slightly too big. That is, setting an acceptance criterion of (PROB>0.05
  will assure that at most 5% of truly compatible histograms are rejected,
  and usually somewhat less."

  Note also that for GoF test of unbinned data ROOT provides also the class
  ROOT::Math::GoFTest. The class has also method for doing one sample tests
  (i.e. comparing the data with a given distribution).
  Return contour values into array levels if pointer levels is non zero

  The function returns the number of contour levels.
  see GetContourLevel to return one contour only
 Return value of contour number level
 use GetContour to return the array of all contour levels
 Return the value of contour number "level" in Pad coordinates ie: if the Pad
 is in log scale along Z it returns le log of the contour level value.
 see GetContour to return the array of all contour levels
set the maximum number of entries to be kept in the buffer
  Set the number and values of contour levels.

  By default the number of contour levels is set to 20. The contours values
  in the array "levels" should be specified in increasing order.

  if argument levels = 0 or missing, equidistant contours are computed
  Return maximum value smaller than maxval of bins in the range,
  unless the value has been overridden by TH1::SetMaximum,
  in which case it returns that value. (This happens, for example,
  when the histogram is drawn and the y or z axis limits are changed

  To get the maximum value of bins in the histogram regardless of
  whether the value has been overridden, use
      h->GetBinContent(h->GetMaximumBin())
Return location of bin with maximum value in the range.
  Return minimum value larger than minval of bins in the range,
  unless the value has been overridden by TH1::SetMinimum,
  in which case it returns that value. (This happens, for example,
  when the histogram is drawn and the y or z axis limits are changed

  To get the minimum value of bins in the histogram regardless of
  whether the value has been overridden, use
     h->GetBinContent(h->GetMinimumBin())
Return location of bin with minimum value in the range.
 Redefine  x and y axis parameters with variable bin sizes.

 The X and Y axis parameters are modified.
 The bins content array is resized
 if errors (Sumw2) the errors array is resized
 The previous bin contents are lost
 To change only the axis limits, see TAxis::SetRange
 xBins is supposed to be of length nx+1, yBins is supposed to be of length ny+1
 Redefine  x, y and z axis parameters with variable bin sizes.

 The X, Y and Z axis parameters are modified.
 The bins content array is resized
 if errors (Sumw2) the errors array is resized
 The previous bin contents are lost
 To change only the axis limits, see TAxis::SetRange
 xBins is supposed to be of length nx+1, yBins is supposed to be of length ny+1,
 zBins is supposed to be of length nz+1
 By default when an histogram is created, it is added to the list
 of histogram objects in the current directory in memory.
 Remove reference to this histogram from current directory and add
 reference to new directory dir. dir can be 0 in which case the
 histogram does not belong to any directory.
 Create structure to store sum of squares of weights.

     if histogram is already filled, the sum of squares of weights
     is filled with the existing bin contents

     The error per bin will be computed as sqrt(sum of squares of weight)
     for each bin.

  This function is automatically called when the histogram is created
  if the static function TH1::SetDefaultSumw2 has been called before.
  If flag = false the structure is deleted
 Return value of error associated to bin number bin.

    if the sum of squares of weights has been defined (via Sumw2),
    this function returns the sqrt(sum of w2).
    otherwise it returns the sqrt(contents) for this bin.
 Return lower error associated to bin number bin.

    The error will depend on the statistic option used will return
     the binContent - lower interval value
 Return upper error associated to bin number bin.

    The error will depend on the statistic option used will return
     the binContent - upper interval value
 return bin center for 1D historam
 Better to use h1.GetXaxis().GetBinCenter(bin)
 return bin lower edge for 1D historam
 Better to use h1.GetXaxis().GetBinLowEdge(bin)
 return bin width for 1D historam
 Better to use h1.GetXaxis().GetBinWidth(bin)
 Fill array with low edge of bins for 1D histogram
 Better to use h1.GetXaxis().GetLowEdge(edge)
 Set bin content
 see convention for numbering bins in TH1::GetBin
 In case the bin number is greater than the number of bins and
 the timedisplay option is set or CanExtendAllAxes(),
 the number of bins is automatically doubled to accommodate the new bin
   This function calculates the background spectrum in this histogram.
   The background is returned as a histogram.

   Function parameters:
   -niter, number of iterations (default value = 2)
      Increasing niter make the result smoother and lower.
   -option: may contain one of the following options
      - to set the direction parameter
        "BackDecreasingWindow". By default the direction is BackIncreasingWindow
      - filterOrder-order of clipping filter,  (default "BackOrder2"
                  -possible values= "BackOrder4"
                                    "BackOrder6"
                                    "BackOrder8"
      - "nosmoothing"- if selected, the background is not smoothed
           By default the background is smoothed.
      - smoothWindow-width of smoothing window, (default is "BackSmoothing3")
                  -possible values= "BackSmoothing5"
                                    "BackSmoothing7"
                                    "BackSmoothing9"
                                    "BackSmoothing11"
                                    "BackSmoothing13"
                                    "BackSmoothing15"
      - "nocompton"- if selected the estimation of Compton edge
                  will be not be included   (by default the compton estimation is set)
      - "same" : if this option is specified, the resulting background
                 histogram is superimposed on the picture in the current pad.
                 This option is given by default.

  NOTE that the background is only evaluated in the current range of this histogram.
  i.e., if this has a bin range (set via h->GetXaxis()->SetRange(binmin, binmax),
  the returned histogram will be created with the same number of bins
  as this input histogram, but only bins from binmin to binmax will be filled
  with the estimated background.
Interface to TSpectrum::Search.
The function finds peaks in this histogram where the width is > sigma
and the peak maximum greater than threshold*maximum bin content of this.
For more details see TSpectrum::Search.
Note the difference in the default value for option compared to TSpectrum::Search
option="" by default (instead of "goff").
For a given transform (first parameter), fills the histogram (second parameter)
with the transform output data, specified in the third parameter
If the 2nd parameter h_output is empty, a new histogram (TH1D or TH2D) is created
and the user is responsible for deleting it.
 Available options:
   "RE" - real part of the output
   "IM" - imaginary part of the output
   "MAG" - magnitude of the output
   "PH"  - phase of the output
    * Set the minimum / maximum value for the Y axis (1-D histograms) or Z axis (2-D histograms)
    *   By default the maximum / minimum value used in drawing is the maximum / minimum value of the histogram
    * plus a margin of 10%. If these functions are called, the values are used without any extra margin.
{ fMaximum = maximum; }TODO: Remove obsolete methods in v6-04
{ Obsolete("GetCellContent", "v6-00", "v6-04"); return GetBinContent(GetBin(binx, biny)); }{ Obsolete("GetCellError", "v6-00", "v6-04"); return GetBinError(binx, biny); }{ Obsolete("RebinAxis", "v6-00", "v6-04"); ExtendAxis(x, axis); }{ Obsolete("SetCellContent", "v6-00", "v6-04"); SetBinContent(GetBin(binx, biny), content); }{ Obsolete("SetCellError", "v6-00", "v6-04"); SetBinError(binx, biny, content); }{ return fSumw2.fN ? fSumw2.fArray[bin] : RetrieveBinContent(bin); }