Loading [MathJax]/extensions/tex2jax.js
Logo ROOT  
Reference Guide
 
All Classes Namespaces Files Functions Variables Typedefs Enumerations Enumerator Properties Friends Macros Modules Pages
Loading...
Searching...
No Matches
transpad.C File Reference

Detailed Description

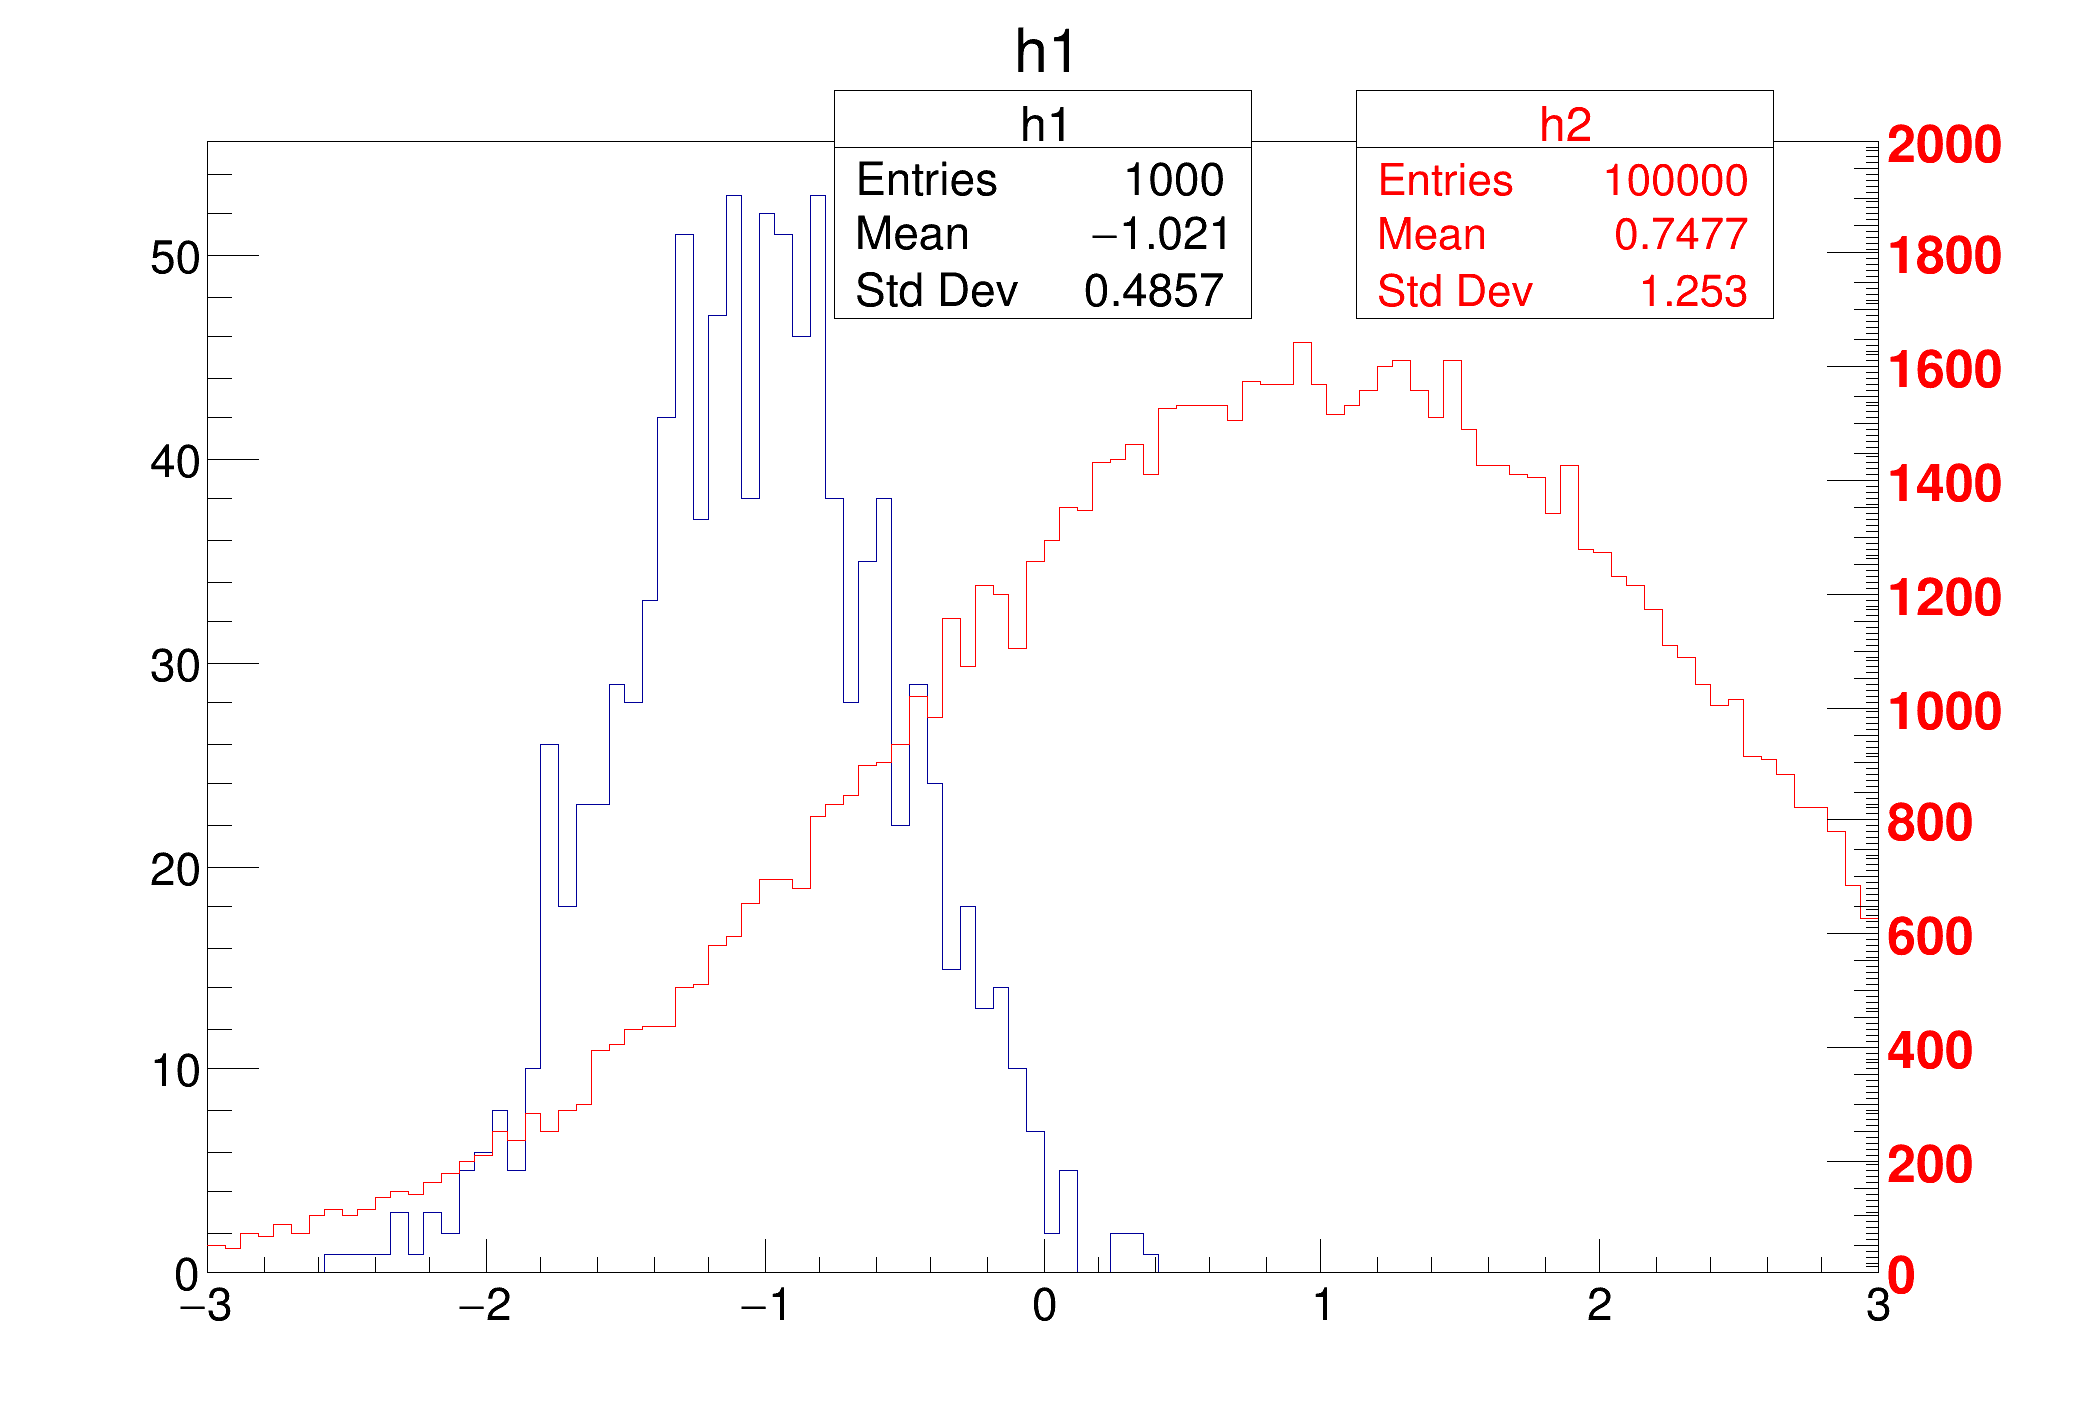
View in nbviewer Open in SWAN Example of a canvas showing two histograms with different scales.

The second histogram is drawn in a transparent pad

void transpad() {
TCanvas *c1 = new TCanvas("c1","transparent pad",200,10,700,500);
TPad *pad1 = new TPad("pad1","",0,0,1,1);
TPad *pad2 = new TPad("pad2","",0,0,1,1);
pad2->SetFillStyle(4000); //will be transparent
pad1->Draw();
pad1->cd();
TH1F *h1 = new TH1F("h1","h1",100,-3,3);
TH1F *h2 = new TH1F("h2","h2",100,-3,3);
for (Int_t i=0;i<100000;i++) {
Double_t x1 = r.Gaus(-1,0.5);
Double_t x2 = r.Gaus(1,1.5);
if (i <1000) h1->Fill(x1);
h2->Fill(x2);
}
h1->Draw();
pad1->Update(); //this will force the generation of the "stats" box
ps1->SetX1NDC(0.4); ps1->SetX2NDC(0.6);
pad1->Modified();
c1->cd();
//compute the pad range with suitable margins
Double_t ymax = 2000;
Double_t dy = (ymax-ymin)/0.8; //10 per cent margins top and bottom
Double_t xmin = -3;
Double_t dx = (xmax-xmin)/0.8; //10 per cent margins left and right
pad2->Range(xmin-0.1*dx,ymin-0.1*dy,xmax+0.1*dx,ymax+0.1*dy);
pad2->Draw();
pad2->cd();
h2->Draw("][sames");
pad2->Update();
ps2->SetX1NDC(0.65); ps2->SetX2NDC(0.85);
// draw axis on the right side of the pad
TGaxis *axis = new TGaxis(xmax,ymin,xmax,ymax,ymin,ymax,50510,"+L");
axis->Draw();
}
ROOT::R::TRInterface & r
Definition Object.C:4
static const double x2[5]
static const double x1[5]
int Int_t
Definition RtypesCore.h:45
double Double_t
Definition RtypesCore.h:59
@ kRed
Definition Rtypes.h:66
float xmin
float ymin
float xmax
float ymax
virtual void SetLineColor(Color_t lcolor)
Set the line color.
Definition TAttLine.h:40
virtual void SetTextColor(Color_t tcolor=1)
Set the text color.
Definition TAttText.h:43
The Canvas class.
Definition TCanvas.h:23
The axis painter class.
Definition TGaxis.h:23
void SetLabelColor(Int_t labelcolor)
Definition TGaxis.h:104
1-D histogram with a float per channel (see TH1 documentation)}
Definition TH1.h:575
virtual Int_t Fill(Double_t x)
Increment bin with abscissa X by 1.
Definition TH1.cxx:3350
TList * GetListOfFunctions() const
Definition TH1.h:243
virtual void Draw(Option_t *option="")
Draw this histogram with options.
Definition TH1.cxx:3073
virtual TObject * FindObject(const char *name) const
Find an object in this list using its name.
Definition TList.cxx:578
virtual void Draw(Option_t *option="")
Default Draw method for all objects.
Definition TObject.cxx:197
The most important graphics class in the ROOT system.
Definition TPad.h:26
void SetFillStyle(Style_t fstyle) override
Override TAttFill::FillStyle for TPad because we want to handle style=0 as style 4000.
Definition TPad.cxx:5921
void Range(Double_t x1, Double_t y1, Double_t x2, Double_t y2) override
Set world coordinate system for the pad.
Definition TPad.cxx:5200
void Update() override
Update pad.
Definition TPad.cxx:2855
void Modified(Bool_t flag=1) override
Definition TPad.h:414
TVirtualPad * cd(Int_t subpadnumber=0) override
Set Current pad.
Definition TPad.cxx:603
void Draw(Option_t *option="") override
Draw Pad in Current pad (re-parent pad if necessary).
Definition TPad.cxx:1299
The histogram statistics painter class.
Definition TPaveStats.h:18
virtual void SetX1NDC(Double_t x1)
Definition TPave.h:78
virtual void SetX2NDC(Double_t x2)
Definition TPave.h:79
This is the base class for the ROOT Random number generators.
Definition TRandom.h:27
return c1
Definition legend1.C:41
TH1F * h1
Definition legend1.C:5
Author
Rene Brun

Definition in file transpad.C.