
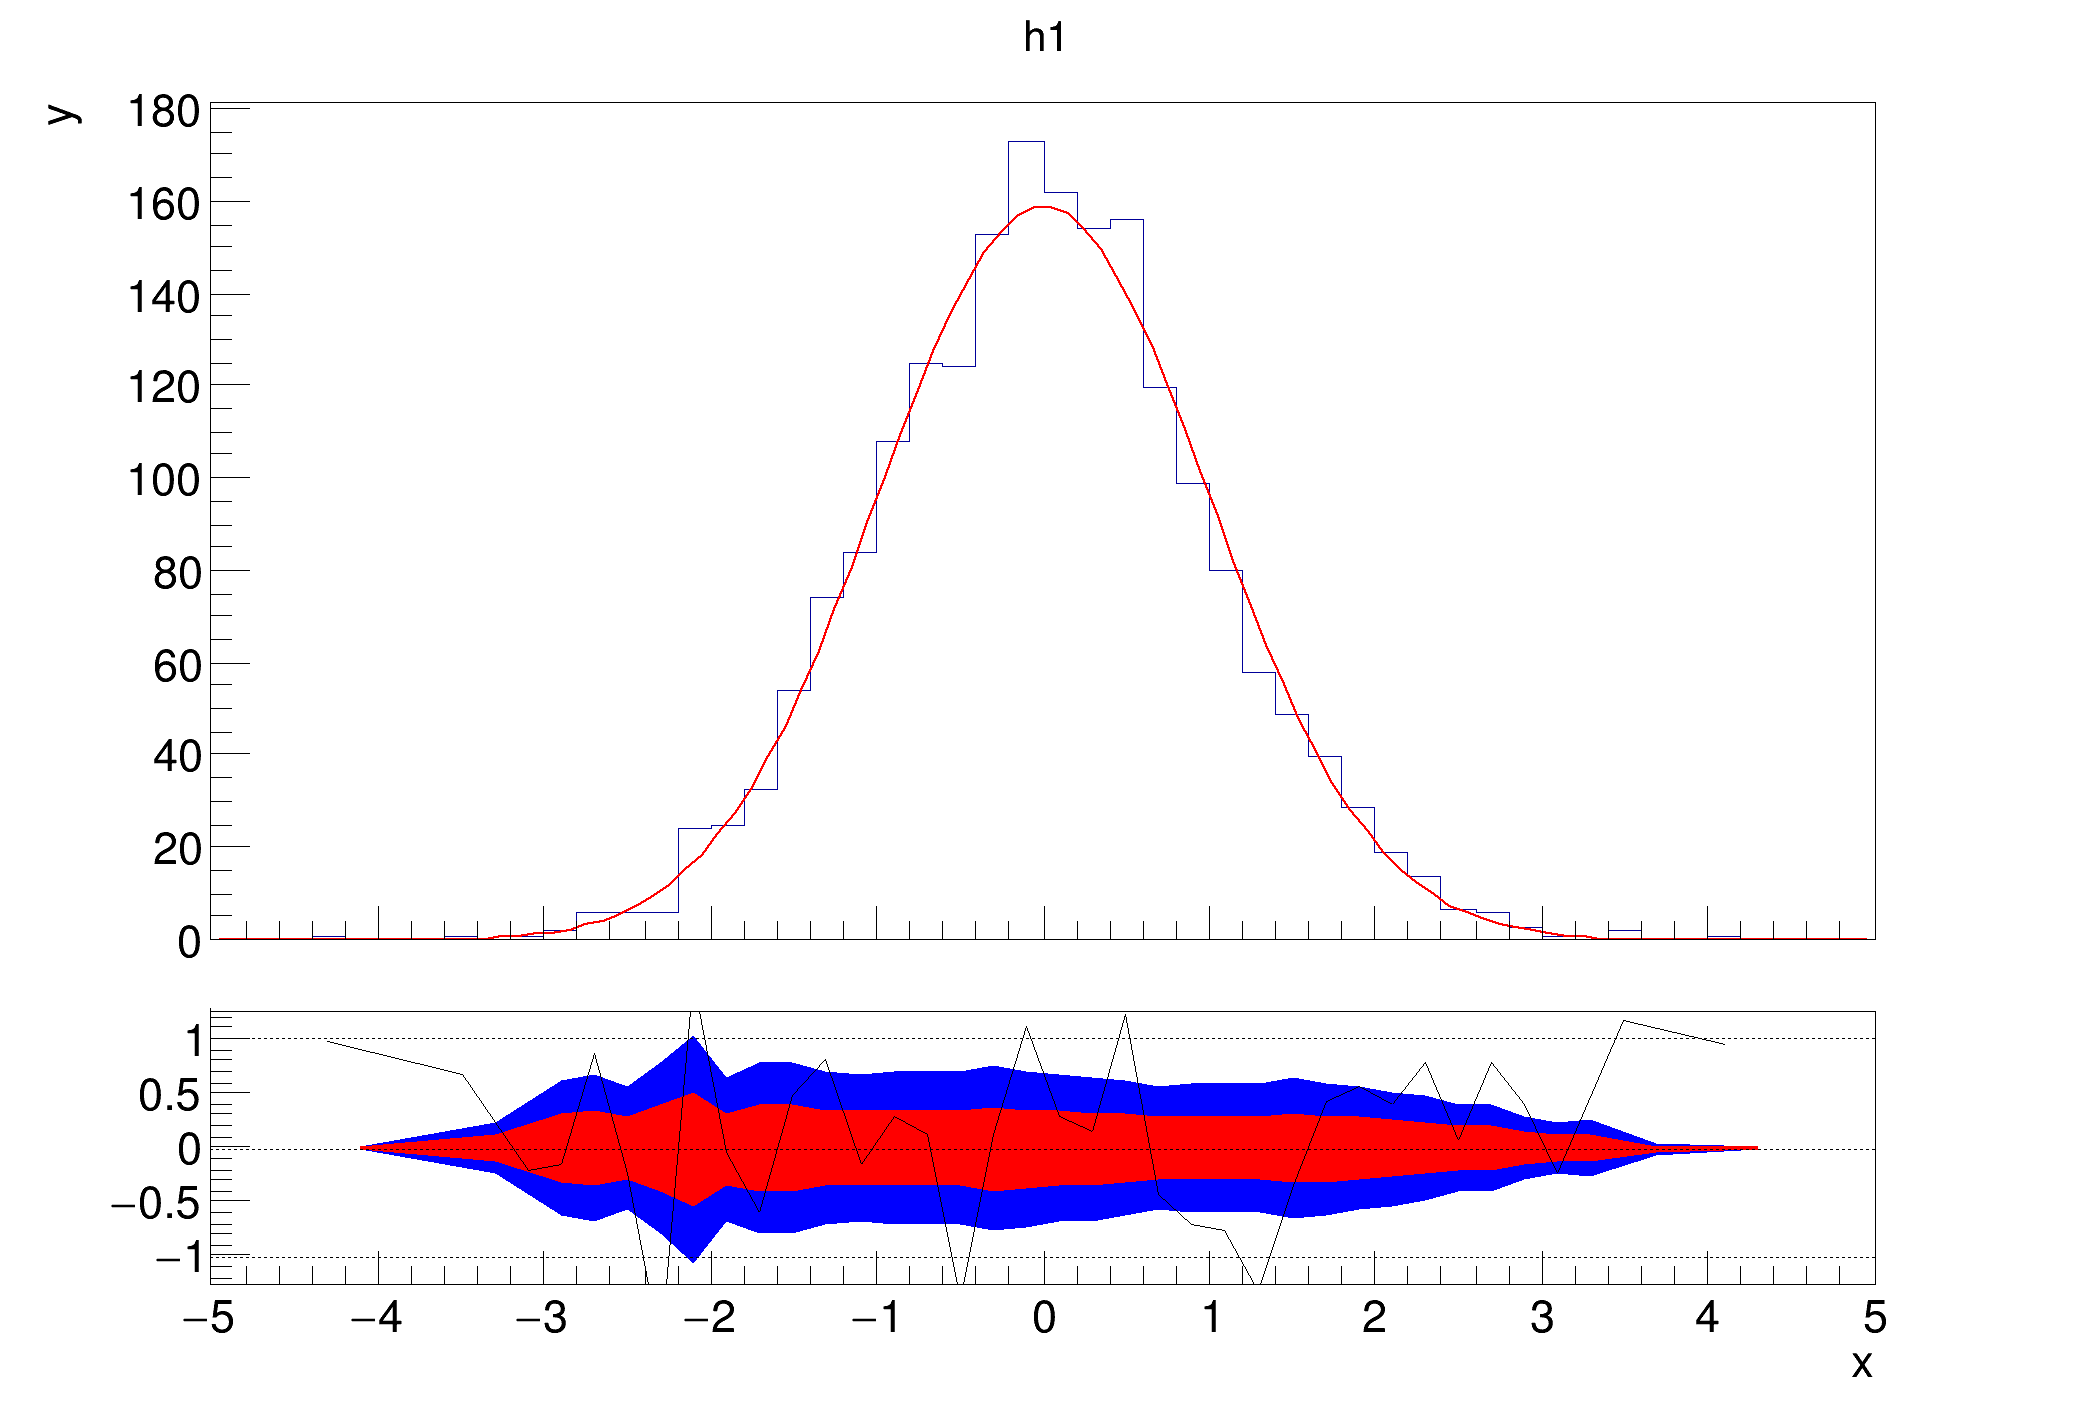
 Example that shows how you can set the colors of the confidence interval bands by using the method
 TRatioPlot::SetConfidenceIntervalColors.
auto c1 =
new TCanvas(
"c1",
"fit residual simple");
auto h1 =
new TH1D(
"h1",
"h1", 50, -5, 5);
rp1->SetConfidenceIntervalColors(
kBlue,
kRed);
rp1->Draw();
}
R__EXTERN TStyle * gStyle
1-D histogram with a double per channel (see TH1 documentation)}
TAxis * GetXaxis()
Get the behaviour adopted by the object about the statoverflows. See EStatOverflows for more informat...
virtual void FillRandom(const char *fname, Int_t ntimes=5000, TRandom *rng=nullptr)
Fill histogram following distribution in function fname.
virtual TFitResultPtr Fit(const char *formula, Option_t *option="", Option_t *goption="", Double_t xmin=0, Double_t xmax=0)
Fit histogram with function fname.
virtual void SetTitle(const char *title="")
Set the title of the TNamed.
Class for displaying ratios, differences and fit residuals.
void SetOptStat(Int_t stat=1)
The type of information printed in the histogram statistics box can be selected via the parameter mod...
- Author
- Paul Gessinger
Definition in file ratioplot5.C.