 |
ROOT
6.07/01
Reference Guide
|
 |
ROOT
6.07/01
Reference Guide
|
This tutorial illustrates how to create an histogram with polygonal bins (TH2Poly), fill it and draw it. More...
Go to the source code of this file.
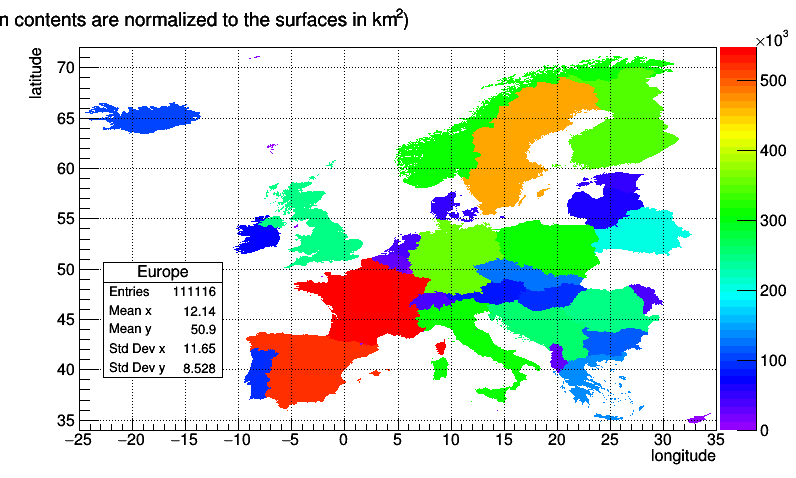
This tutorial illustrates how to create an histogram with polygonal bins (TH2Poly), fill it and draw it.
The initial data are stored in TMultiGraphs. They represent the european countries. The histogram filling is done according to a Mercator projection, therefore the bin contains should be proportional to the real surface of the countries.
The initial data have been downloaded from: http://www.maproom.psu.edu/dcw/ This database was developed in 1991/1992 and national boundaries reflect political reality as of that time.
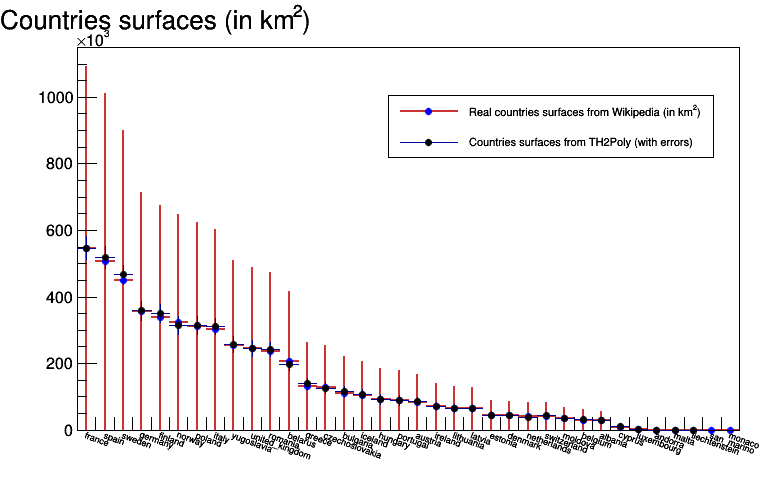
The script is shooting npoints (script argument) randomly over the Europe area. The number of points inside the countries should be proportional to the country surface The estimated surface is compared to the surfaces taken from wikipedia.


Definition in file th2polyEurope.C.