ROOT  6.07/01
Reference Guide
 All Classes Namespaces Files Functions Variables Typedefs Enumerations Enumerator Properties Friends Macros Groups Pages
ratioplot.C File Reference

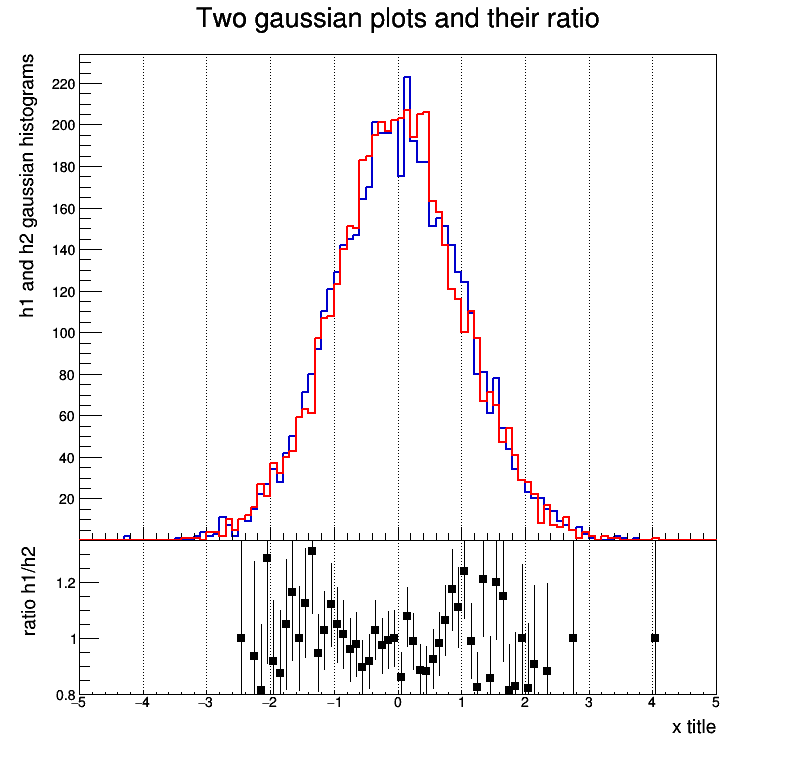
Example displaying two histograms and their ratio. More...
Go to the source code of this file.

Detailed Description

Example displaying two histograms and their ratio.

pict1_ratioplot.C.png
void ratioplot() {
// Define two gaussian histograms. Note the X and Y title are defined
// at booking time using the convention "Hist_title ; X_title ; Y_title"
TH1F *h1 = new TH1F("h1", "Two gaussian plots and their ratio;x title; h1 and h2 gaussian histograms", 100, -5, 5);
TH1F *h2 = new TH1F("h2", "h2", 100, -5, 5);
h1->FillRandom("gaus");
h2->FillRandom("gaus");
// Define the Canvas
TCanvas *c = new TCanvas("c", "canvas", 800, 800);
// Upper plot will be in pad1
TPad *pad1 = new TPad("pad1", "pad1", 0, 0.3, 1, 1.0);
pad1->SetBottomMargin(0); // Upper and lower plot are joined
pad1->SetGridx(); // Vertical grid
pad1->Draw(); // Draw the upper pad: pad1
pad1->cd(); // pad1 becomes the current pad
h1->SetStats(0); // No statistics on upper plot
h1->Draw(); // Draw h1
h2->Draw("same"); // Draw h2 on top of h1
// Do not draw the Y axis label on the upper plot and redraw a small
// axis instead, in order to avoid the first label (0) to be clipped.
h1->GetYaxis()->SetLabelSize(0.);
TGaxis *axis = new TGaxis( -5, 20, -5, 220, 20,220,510,"");
axis->SetLabelFont(43); // Absolute font size in pixel (precision 3)
axis->SetLabelSize(15);
axis->Draw();
// lower plot will be in pad
c->cd(); // Go back to the main canvas before defining pad2
TPad *pad2 = new TPad("pad2", "pad2", 0, 0.05, 1, 0.3);
pad2->SetTopMargin(0);
pad2->SetBottomMargin(0.2);
pad2->SetGridx(); // vertical grid
pad2->Draw();
pad2->cd(); // pad2 becomes the current pad
// Define the ratio plot
TH1F *h3 = (TH1F*)h1->Clone("h3");
h3->SetMinimum(0.8); // Define Y ..
h3->SetMaximum(1.35); // .. range
h3->Sumw2();
h3->SetStats(0); // No statistics on lower plot
h3->Divide(h2);
h3->SetMarkerStyle(21);
h3->Draw("ep"); // Draw the ratio plot
// h1 settings
h1->SetLineWidth(2);
// Y axis h1 plot settings
h1->GetYaxis()->SetTitleSize(20);
h1->GetYaxis()->SetTitleFont(43);
h1->GetYaxis()->SetTitleOffset(1.55);
// h2 settings
h2->SetLineWidth(2);
// Ratio plot (h3) settings
h3->SetTitle(""); // Remove the ratio title
// Y axis ratio plot settings
h3->GetYaxis()->SetTitle("ratio h1/h2 ");
h3->GetYaxis()->SetNdivisions(505);
h3->GetYaxis()->SetTitleSize(20);
h3->GetYaxis()->SetTitleFont(43);
h3->GetYaxis()->SetTitleOffset(1.55);
h3->GetYaxis()->SetLabelFont(43); // Absolute font size in pixel (precision 3)
h3->GetYaxis()->SetLabelSize(15);
// X axis ratio plot settings
h3->GetXaxis()->SetTitleSize(20);
h3->GetXaxis()->SetTitleFont(43);
h3->GetXaxis()->SetLabelFont(43); // Absolute font size in pixel (precision 3)
h3->GetXaxis()->SetLabelSize(15);
}
Author
Olivier Couet

Definition in file ratioplot.C.