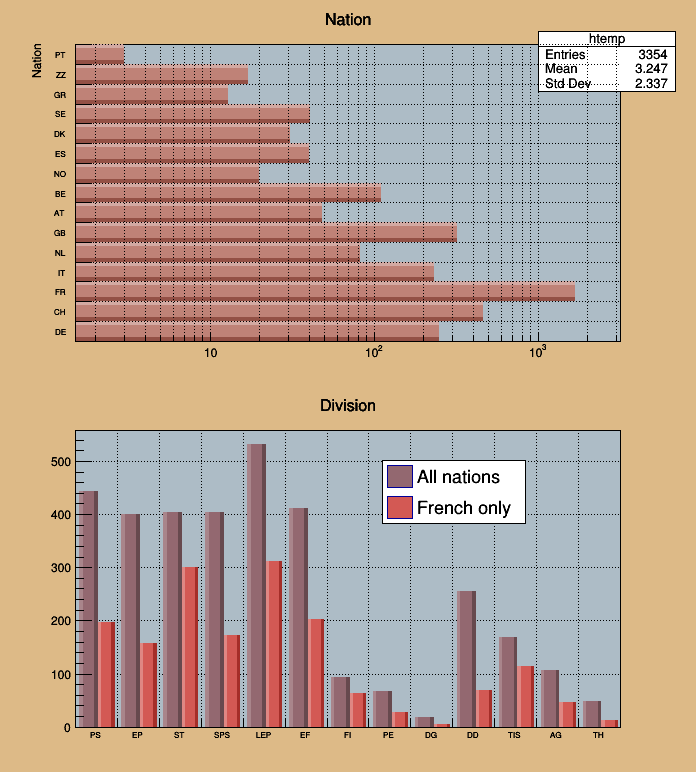
Example of bar charts with 1-d histograms.
More...
Go to the source code of this file.
Example of bar charts with 1-d histograms.
TString filename =
"cernstaff.root";
if (fileNotFound) {
TString macroName = filedir +
"cernbuild.C";
gROOT->ProcessLineFast(
"cernbuild()");
}
if (!f) {
Error(
"hbars",
"file cernstaff.root not found");
return 0;
}
if (!T) {
Error(
"hbars",
"Tree T is not present in file %s",f->
GetName() );
return 0;
}
c1->
cd(1);
gPad->SetGrid();
gPad->SetLogx();
gPad->SetFrameFillColor(33);
T->
Draw(
"Nation",
"",
"hbar2");
c1->
cd(2);
gPad->SetGrid();
gPad->SetFrameFillColor(33);
T->
Draw(
"Division>>hDiv",
"",
"goff");
T->
Draw(
"Division>>hDivFR",
"Nation==\"FR\"",
"goff");
}
- Author
- Rene Brun
Definition in file hbars.C.