 |
ROOT
6.07/01
Reference Guide
|


All Classes Namespaces Files Functions Variables Typedefs Enumerations Enumerator Properties Friends Macros Groups Pages
|
ROOT
6.07/01
Reference Guide
|
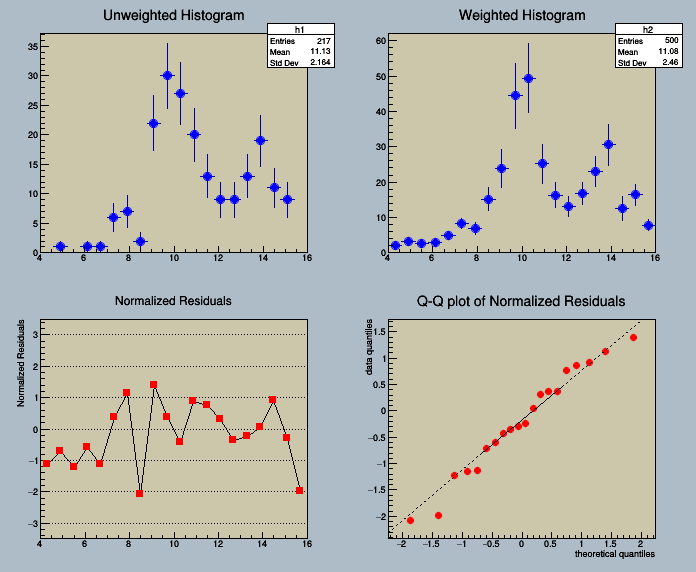
Example to use chi2 test for comparing two histograms One unweighted histogram is compared with a weighted histogram. More...
Go to the source code of this file.
Example to use chi2 test for comparing two histograms One unweighted histogram is compared with a weighted histogram.
The normalized residuals are retrieved and plotted in a simple graph. The QQ plot of the normalized residual using the normal distribution is also plotted.
Definition in file chi2test.C.
 ROOT 6.07/01 - Reference Guide Generated on Wed Dec 9 2015 00:23:05 using Doxygen 1.8.6.