ROOT  6.07/01
Reference Guide
 All Classes Namespaces Files Functions Variables Typedefs Enumerations Enumerator Properties Friends Macros Groups Pages
calo_detail.C File Reference

Calorimeter detailed view by using TEveCaloDataVec as data-source. More...

Go to the source code of this file.

Detailed Description

Calorimeter detailed view by using TEveCaloDataVec as data-source.

Demonstrates how to plot calorimeter data with irregular bins.
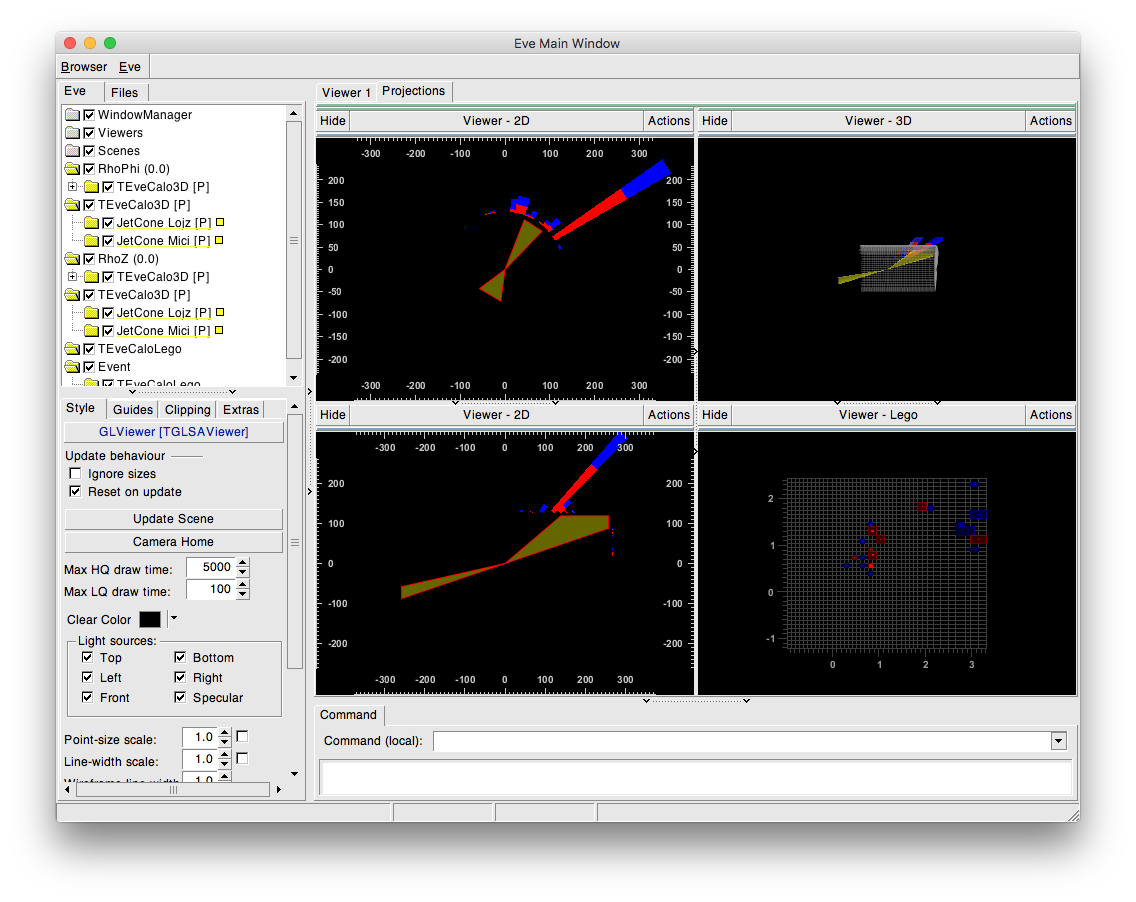
eve_calo_detail.png
#include "calorimeters.C"
TEveCaloDataVec* MakeVecData(Int_t ncells=0);
void calo_detail()
{
// data
TEveCaloDataVec* data = MakeVecData(20);
data->IncDenyDestroy(); // don't delete if zero parent
// frames
TEveWindowPack* packH = slot->MakePack();
packH->SetElementName("Projections");
packH->SetHorizontal();
packH->SetShowTitleBar(kFALSE);
slot = packH->NewSlot();
TEveWindowPack* pack0 = slot->MakePack();
TEveWindowSlot* slotLeftTop = pack0->NewSlot();
TEveWindowSlot* slotLeftBottom = pack0->NewSlot();
slot = packH->NewSlot();
TEveWindowPack* pack1 = slot->MakePack();
TEveWindowSlot* slotRightTop = pack1->NewSlot();
TEveWindowSlot* slotRightBottom = pack1->NewSlot();
// viewers ans scenes in second tab
Float_t maxH = 300;
TEveCalo3D* calo3d = MakeCalo3D(data, slotRightTop);
calo3d->SetMaxTowerH(maxH);
TEveCalo2D* calo2d;
calo2d = MakeCalo2D(calo3d, slotLeftTop, TEveProjection::kPT_RPhi);
calo2d->SetMaxTowerH(maxH);
calo2d = MakeCalo2D(calo3d, slotLeftBottom, TEveProjection::kPT_RhoZ);
calo2d->SetMaxTowerH(maxH);
TEveCaloLego* lego = MakeCaloLego(data, slotRightBottom);
gEve->AddElement(lego);
}
//______________________________________________________________________________
TEveCaloDataVec* MakeVecData(Int_t ncells)
{
// Example how to fill data when bins can be iregular.
// If ncells = 0 (default) whole histogram is taken,
// otherwise just ncells cells around the maximum.
TFile* hf = TFile::Open(histFile, "CACHEREAD");
TH2F* h1 = (TH2F*)hf->Get("ecalLego");
TH2F* h2 = (TH2F*)hf->Get("hcalLego");
data->RefSliceInfo(0).Setup("ECAL", 0.3, kRed);
data->RefSliceInfo(1).Setup("HCAL", 0.1, kBlue);
TAxis *ax = h1->GetXaxis();
TAxis *ay = h1->GetYaxis();
Int_t xm = 1, xM = ax->GetNbins();
Int_t ym = 1, yM = ay->GetNbins();
if (ncells != 0)
{
Int_t cx, cy, cz;
h1->GetMaximumBin(cx, cy, cz);
xm = TMath::Max(xm, cx-ncells);
xM = TMath::Min(xM, cx+ncells);
ym = TMath::Max(ym, cy-ncells);
yM = TMath::Min(yM, cy+ncells);
}
// Take every second cell and set a random size.
for(Int_t i=xm; i<=xM; i+=2)
{
for(Int_t j=ym; j<=yM; j+=2)
{
if ( (i+j) % 3)
{
data->AddTower(ax->GetBinLowEdge(i), ax->GetBinUpEdge(i),
ay->GetBinLowEdge(j), ay->GetBinUpEdge(j));
data->FillSlice(0, h1->GetBinContent(i, j));
data->FillSlice(1, h2->GetBinContent(i, j));
}
else
{
data->AddTower(ax->GetBinLowEdge(i),
2 * ax->GetBinWidth(i) + ax->GetBinLowEdge(i),
ay->GetBinLowEdge(j),
2 * ay->GetBinWidth(j) + ay->GetBinLowEdge(j));
data->FillSlice(0, h2->GetBinContent(i, j));
data->FillSlice(1, h2->GetBinContent(i, j));
}
}
}
data->SetEtaBins(ax);
data->SetPhiBins(ay);
data->DataChanged();
return data;
}
Author
Alja Mrak-Tadel

Definition in file calo_detail.C.