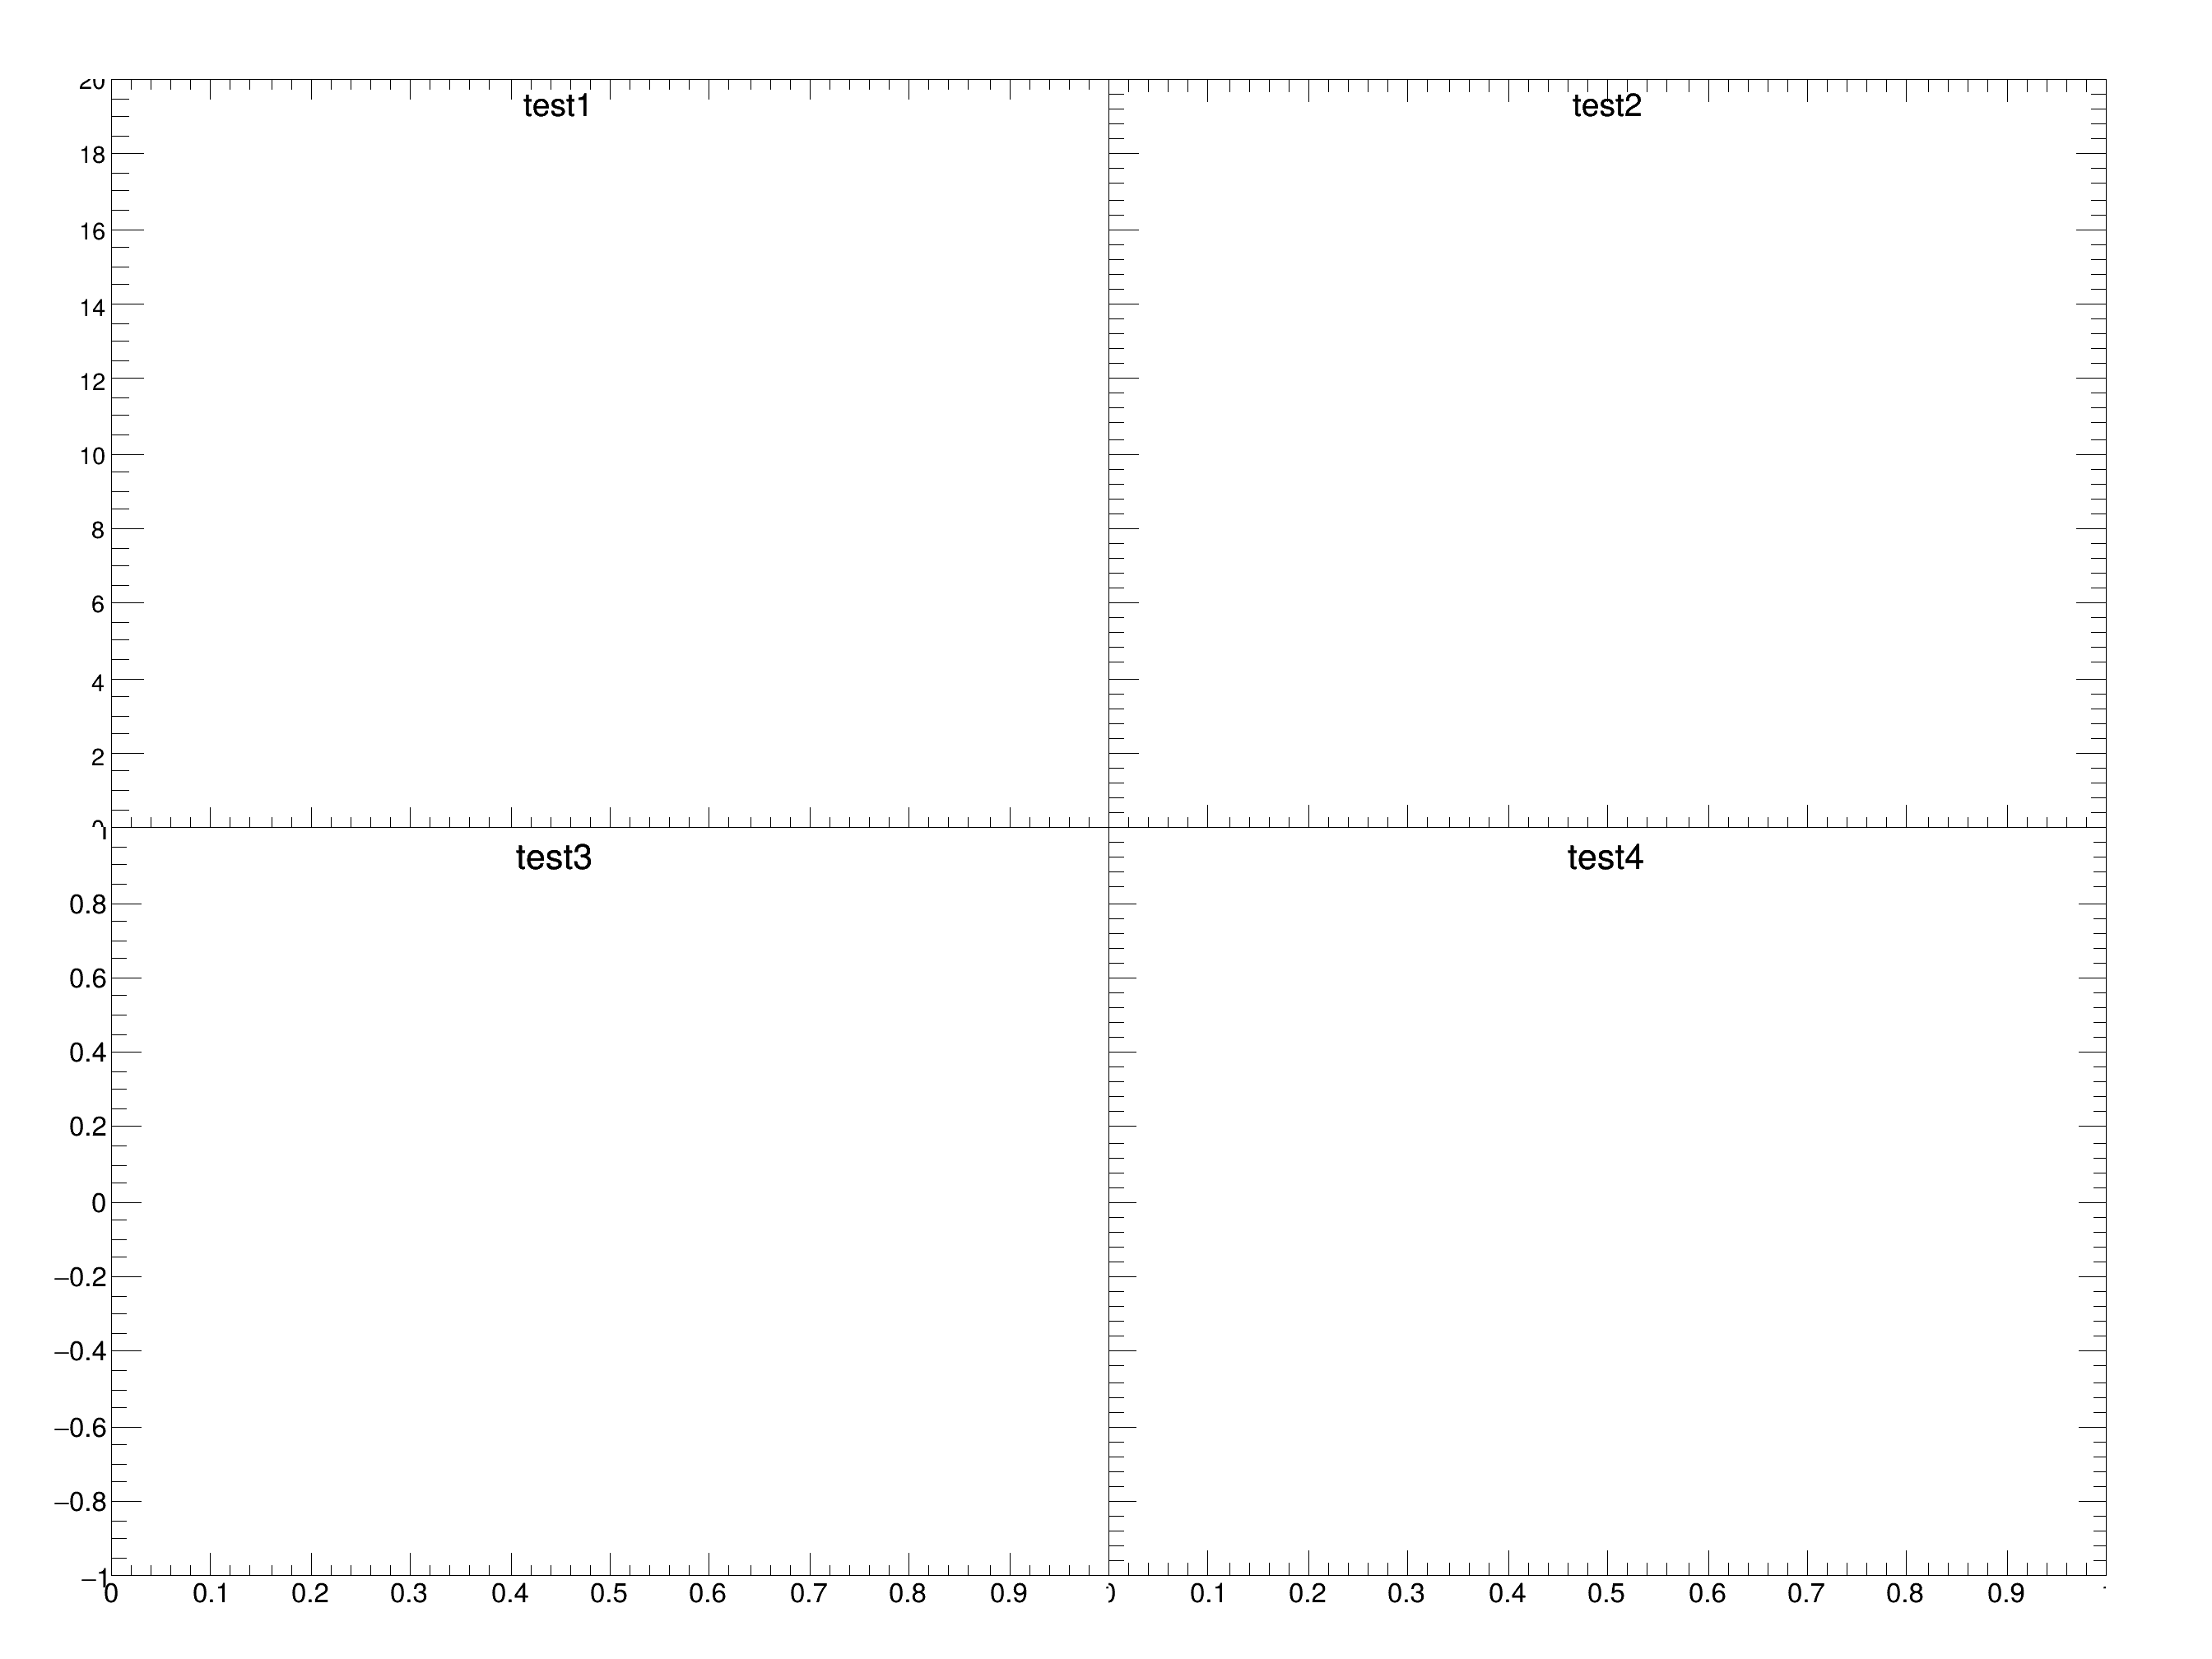

Example of script showing how to divide a canvas into adjacent subpads + axis labels on the top and right side of the pads.
TH2F *h2 =
new TH2F(
"h2",
"test2",10,0,1,20,0,100);
TH2F *h3 =
new TH2F(
"h3",
"test3",10,0,1,20,-1,1);
TH2F *h4 =
new TH2F(
"h4",
"test4",10,0,1,20,0,1000);
h2->GetYaxis()->SetLabelOffset(0.01);
h2->Draw();
h3->Draw();
}
R__EXTERN TStyle * gStyle
void Draw(Option_t *option="") override
Draw this histogram with options.
2-D histogram with a float per channel (see TH1 documentation)
void SetOptStat(Int_t stat=1)
The type of information printed in the histogram statistics box can be selected via the parameter mod...
- Author
- Rene Brun
Definition in file zones.C.


