Logo ROOT  
Reference Guide
 
Loading...
Searching...
No Matches
perceptualcolormap.C File Reference

Detailed Description

View in nbviewer Open in SWAN
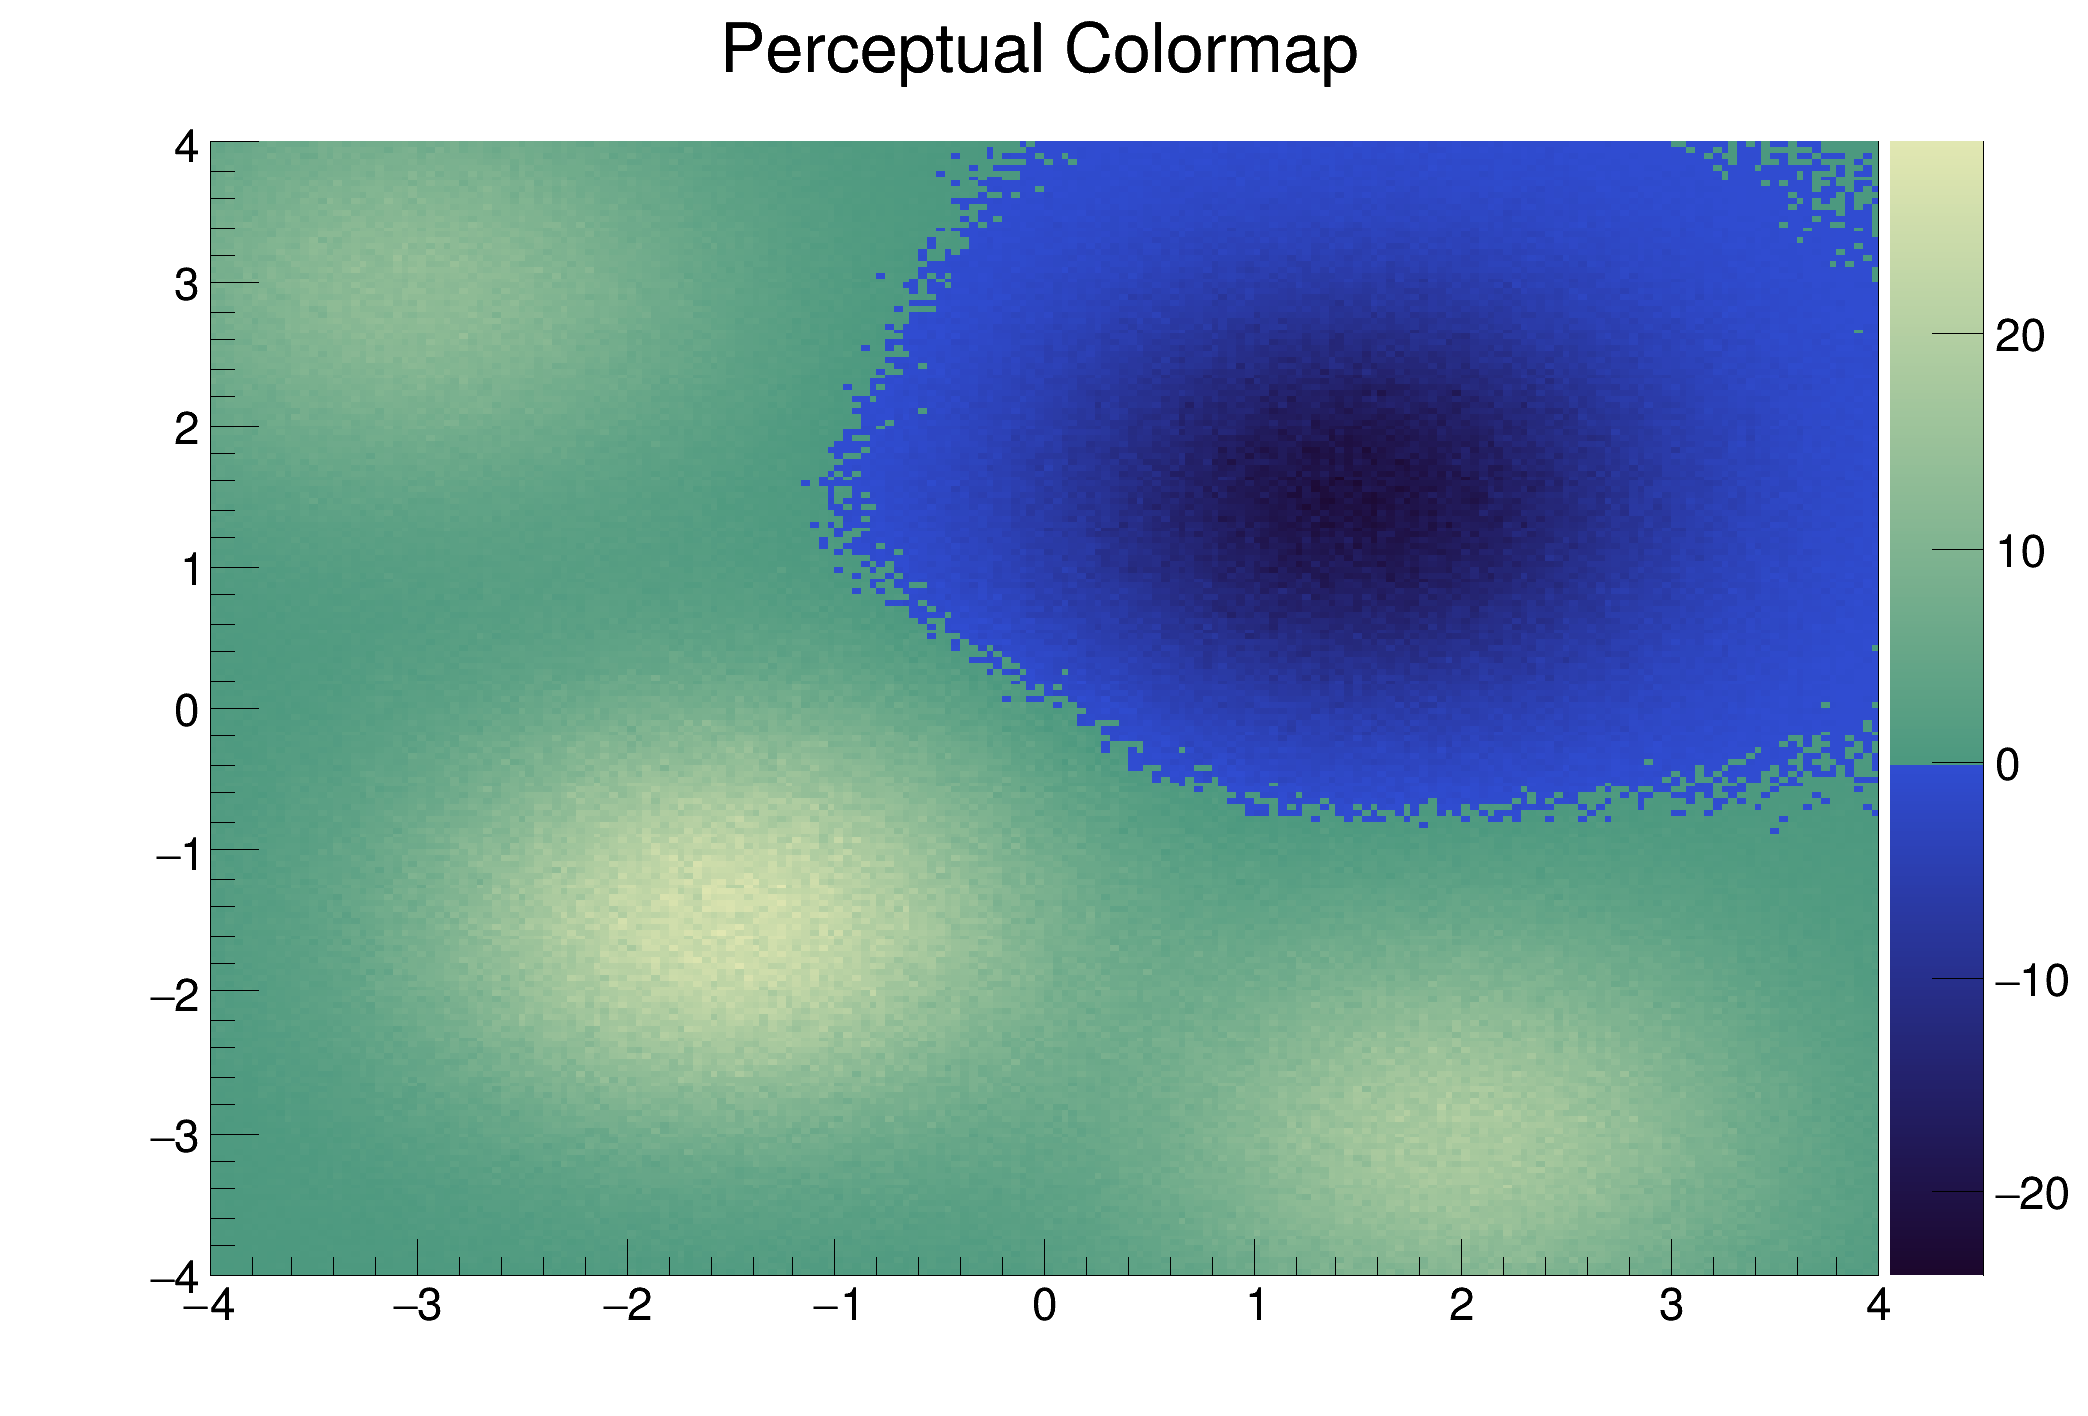
A “Perceptual” colormap explicitly identifies a fixed value in the data

On geographical plot this fixed point can, for instance, the "sea level". A perceptual colormap provides a monotonic luminance variations above and below this fixed value. Unlike the rainbow colormap, this colormap provides a faithful representation of the structures in the data.

This macro demonstrates how to produce the perceptual colormap shown on the figure 2 in this article.

The function Perceptual_Colormap takes two parameters as input:

  1. h, the TH2D to be drawn
  2. val_cut, the Z value defining the "sea level"

Having these parameters this function defines two color maps: one above val_cut and one below.

void Perceptual_Colormap(TH2D *h, Double_t val_cut) {
Double_t max = h->GetMaximum(); // Histogram's maximum
Double_t min = h->GetMinimum(); // Histogram's minimum
Double_t per_cut = (val_cut-min)/(max-min); // normalized value of val_cut
Double_t eps = (max-min)*0.00001; // epsilon
// Definition of the two palettes below and above val_cut
const Int_t Number = 4;
Double_t Red[Number] = { 0.11, 0.19 , 0.30, 0.89};
Double_t Green[Number] = { 0.03, 0.304, 0.60, 0.91};
Double_t Blue[Number] = { 0.18, 0.827, 0.50, 0.70};
Double_t Stops[Number] = { 0., per_cut, per_cut+eps, 1. };
Int_t nb= 256;
h->SetContour(nb);
TColor::CreateGradientColorTable(Number,Stops,Red,Green,Blue,nb);
// Histogram drawing
h->Draw("colz");
}
void perceptualcolormap() {
TH2D *h = new TH2D("h","Perceptual Colormap",200,-4,4,200,-4,4);
h->SetStats(0);
for (Int_t i=0;i<1000000;i++) {
h->Fill(a-1.5,b-1.5,0.1);
h->Fill(a+2.,b-3.,0.07);
h->Fill(a-3.,b+3.,0.05);
h->Fill(a+1.5,b+1.5,-0.08);
}
Perceptual_Colormap(h, 0.);
}
#define b(i)
Definition RSha256.hxx:100
#define a(i)
Definition RSha256.hxx:99
#define h(i)
Definition RSha256.hxx:106
int Int_t
Definition RtypesCore.h:45
double Double_t
Definition RtypesCore.h:59
R__EXTERN TRandom * gRandom
Definition TRandom.h:62
static Int_t CreateGradientColorTable(UInt_t Number, Double_t *Stops, Double_t *Red, Double_t *Green, Double_t *Blue, UInt_t NColors, Float_t alpha=1., Bool_t setPalette=kTRUE)
Static function creating a color table with several connected linear gradients.
Definition TColor.cxx:2549
2-D histogram with a double per channel (see TH1 documentation)
Definition TH2.h:338
virtual void Rannor(Float_t &a, Float_t &b)
Return 2 numbers distributed following a gaussian with mean=0 and sigma=1.
Definition TRandom.cxx:507
Author
Olivier Couet

Definition in file perceptualcolormap.C.