A TExec allows to redraw automatically the projections when a zoom is performed on the 2D histogram.
TPad *right_pad, *top_pad;
void hist019_TH2_projection()
{
TPad *center_pad =
new TPad(
"center_pad",
"center_pad", 0.0, 0.0, 0.6, 0.6);
right_pad =
new TPad(
"right_pad",
"right_pad", 0.55, 0.0, 1.0, 0.6);
top_pad =
new TPad(
"top_pad",
"top_pad", 0.0, 0.55, 0.6, 1.0);
h2 =
new TH2F(
"h2",
"", 40, -4, 4, 40, -20, 20);
for (
Int_t i = 0; i < 25000; i++) {
}
t.
DrawLatex(0.6, 0.88,
"This example demonstrates how to display");
t.
DrawLatex(0.6, 0.85,
"a histogram and its two projections.");
auto ex =
new TExec(
"zoom",
"ZoomExec()");
}
void ZoomExec()
{
}
int Int_t
Signed integer 4 bytes (int).
float Float_t
Float 4 bytes (float).
virtual void SetFillColor(Color_t fcolor)
Set the fill area color.
virtual void SetTextFont(Font_t tfont=62)
Set the text font.
virtual void SetTextSize(Float_t tsize=1)
Set the text size.
virtual Double_t GetBinLowEdge(Int_t bin) const
Return low edge of bin.
Int_t GetLast() const
Return last bin on the axis i.e.
virtual void SetRangeUser(Double_t ufirst, Double_t ulast)
Set the viewing range for the axis from ufirst to ulast (in user coordinates, that is,...
virtual Double_t GetBinUpEdge(Int_t bin) const
Return up edge of bin.
Int_t GetFirst() const
Return first bin on the axis i.e.
TExec is a utility class that can be used to execute a C++ command when some event happens in a pad.
1-D histogram with a double per channel (see TH1 documentation)
void Draw(Option_t *option="") override
Default Draw method for all objects.
TList * GetListOfFunctions() const
2-D histogram with a float per channel (see TH1 documentation)
TH1D * ProjectionY(const char *name="_py", Int_t firstxbin=0, Int_t lastxbin=-1, Option_t *option="") const
Project a 2-D histogram into a 1-D histogram along Y (integration along X).
TH1D * ProjectionX(const char *name="_px", Int_t firstybin=0, Int_t lastybin=-1, Option_t *option="") const
Project a 2-D histogram into a 1-D histogram along X (integration along Y).
Int_t Fill(Double_t) override
Invalid Fill method.
TLatex * DrawLatex(Double_t x, Double_t y, const char *text)
void Add(TObject *obj) override
The most important graphics class in the ROOT system.
void Modified(Bool_t flag=true) override
TVirtualPad * cd(Int_t subpadnumber=0) override
Set Current pad.
void Draw(Option_t *option="") override
Draw Pad in Current pad (re-parent pad if necessary).

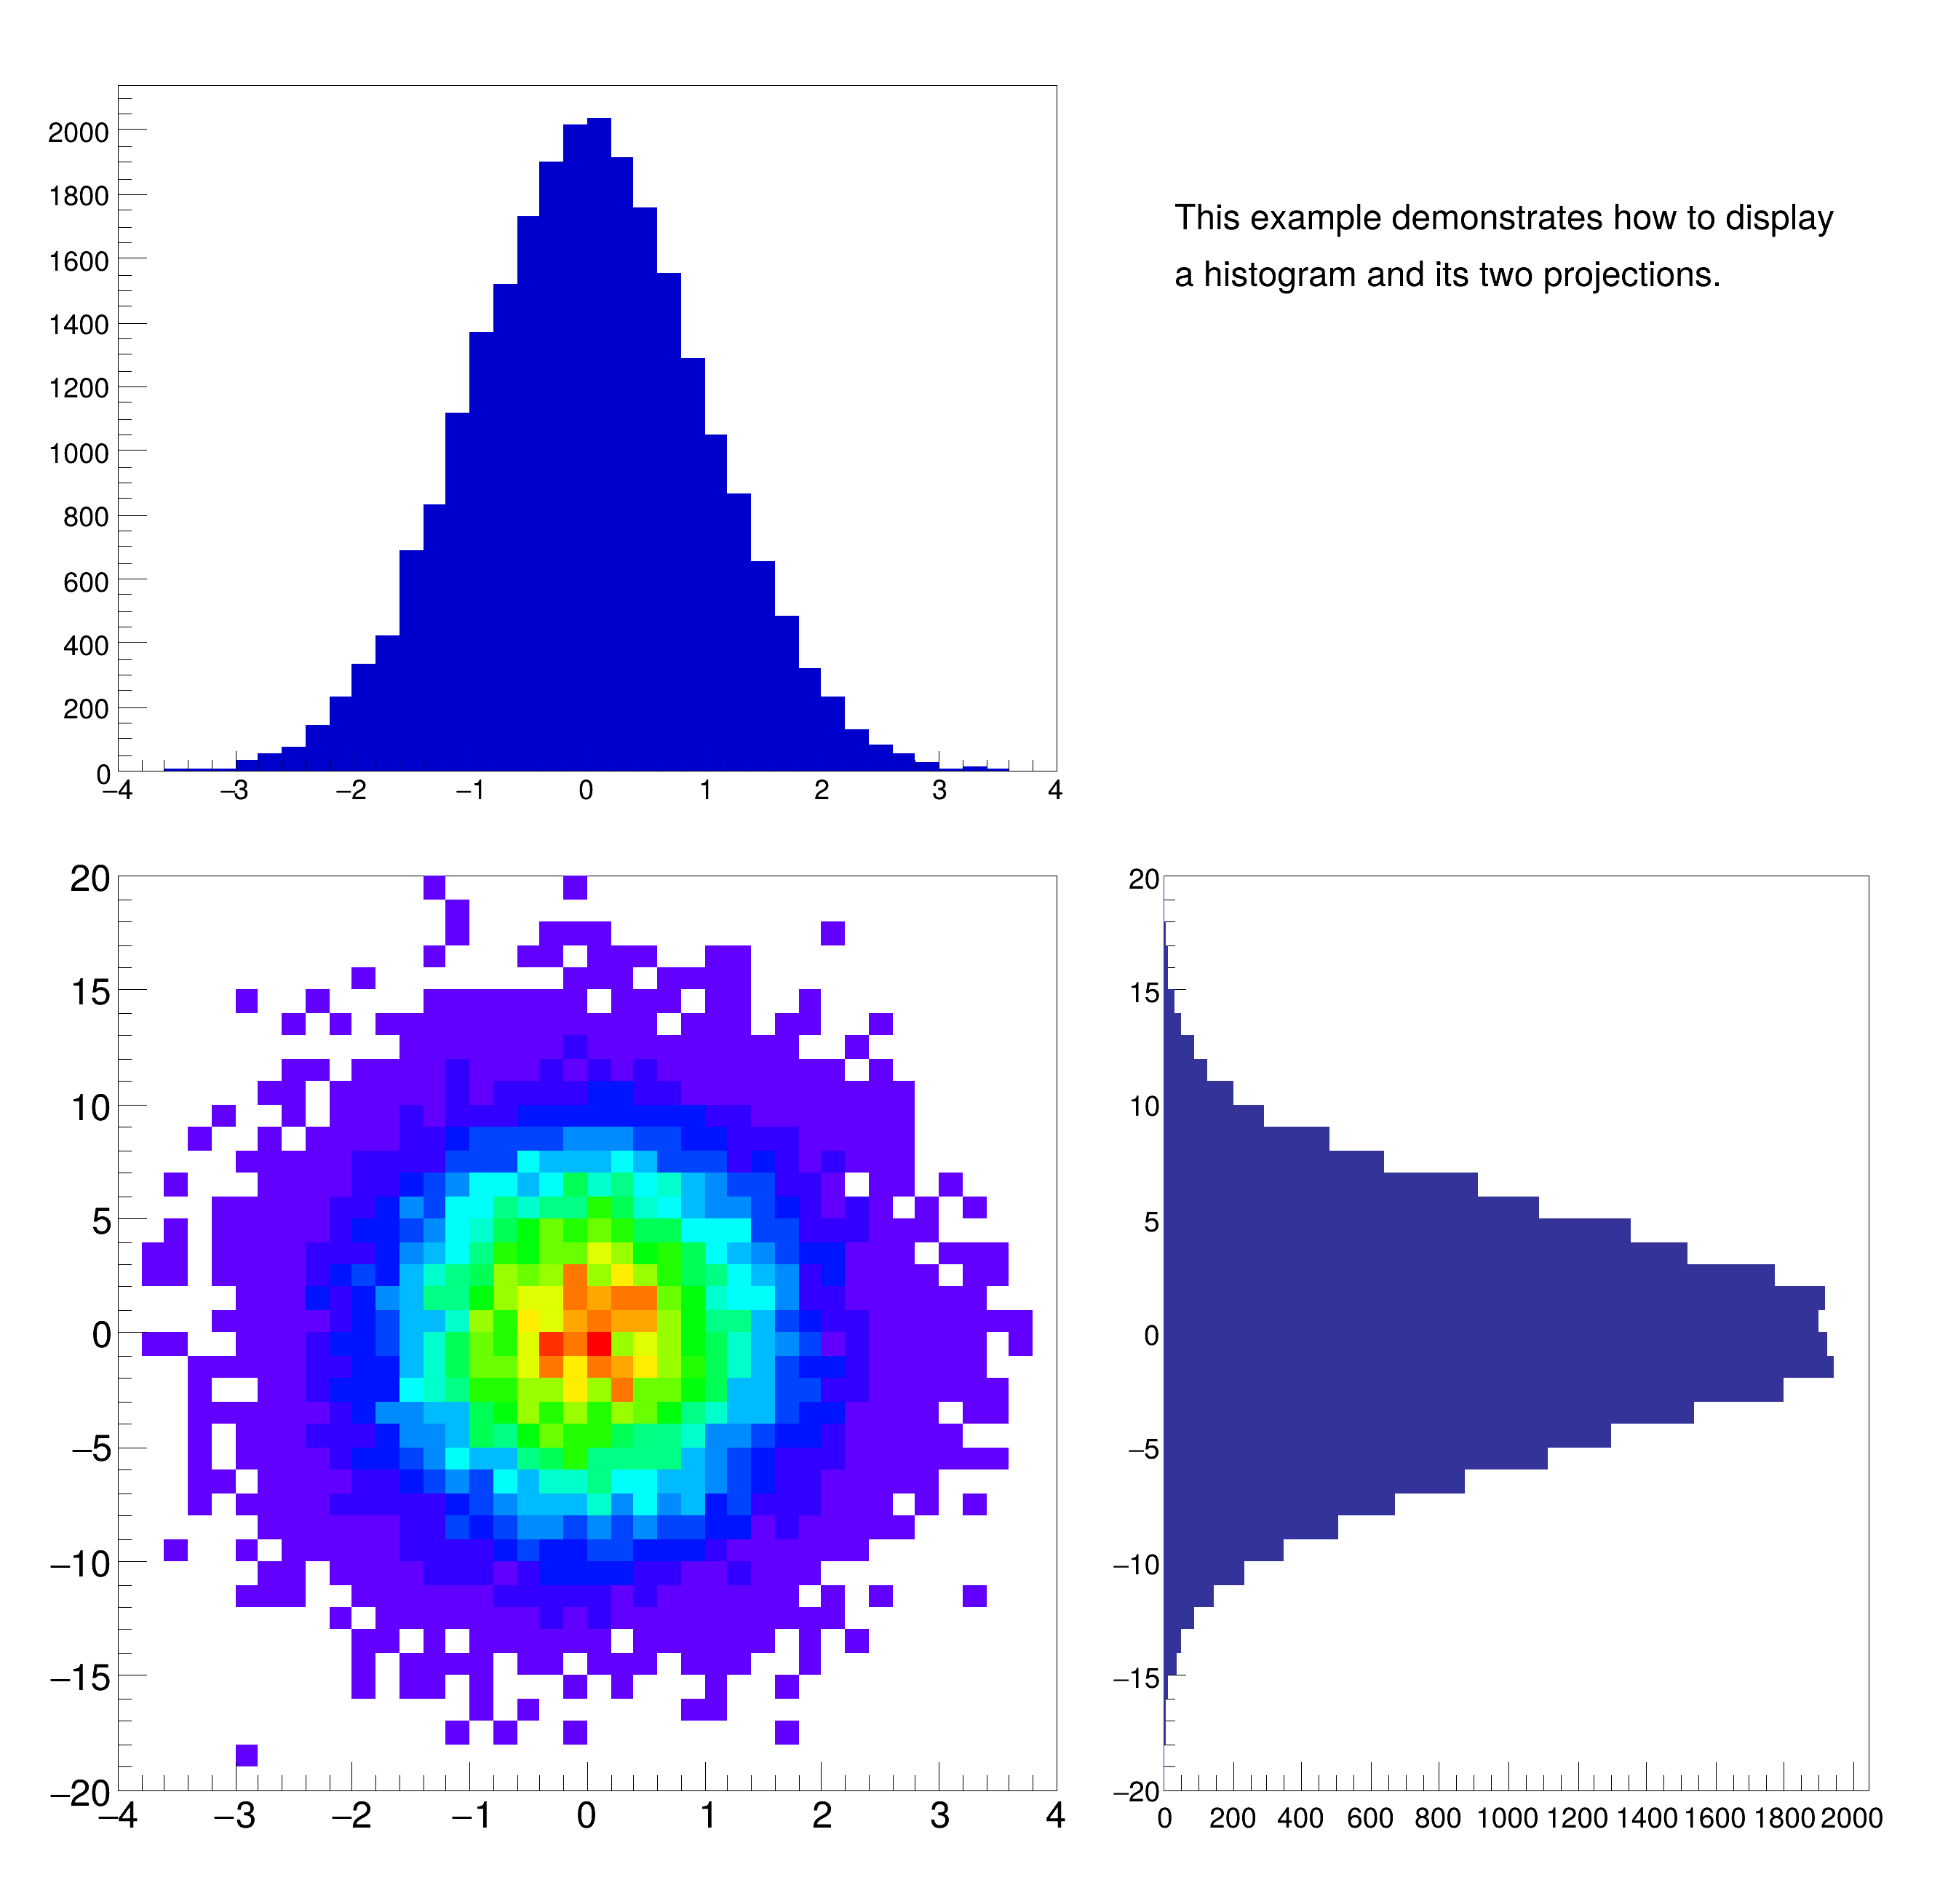 This example demonstrates how to display a histogram and its two projections.
