

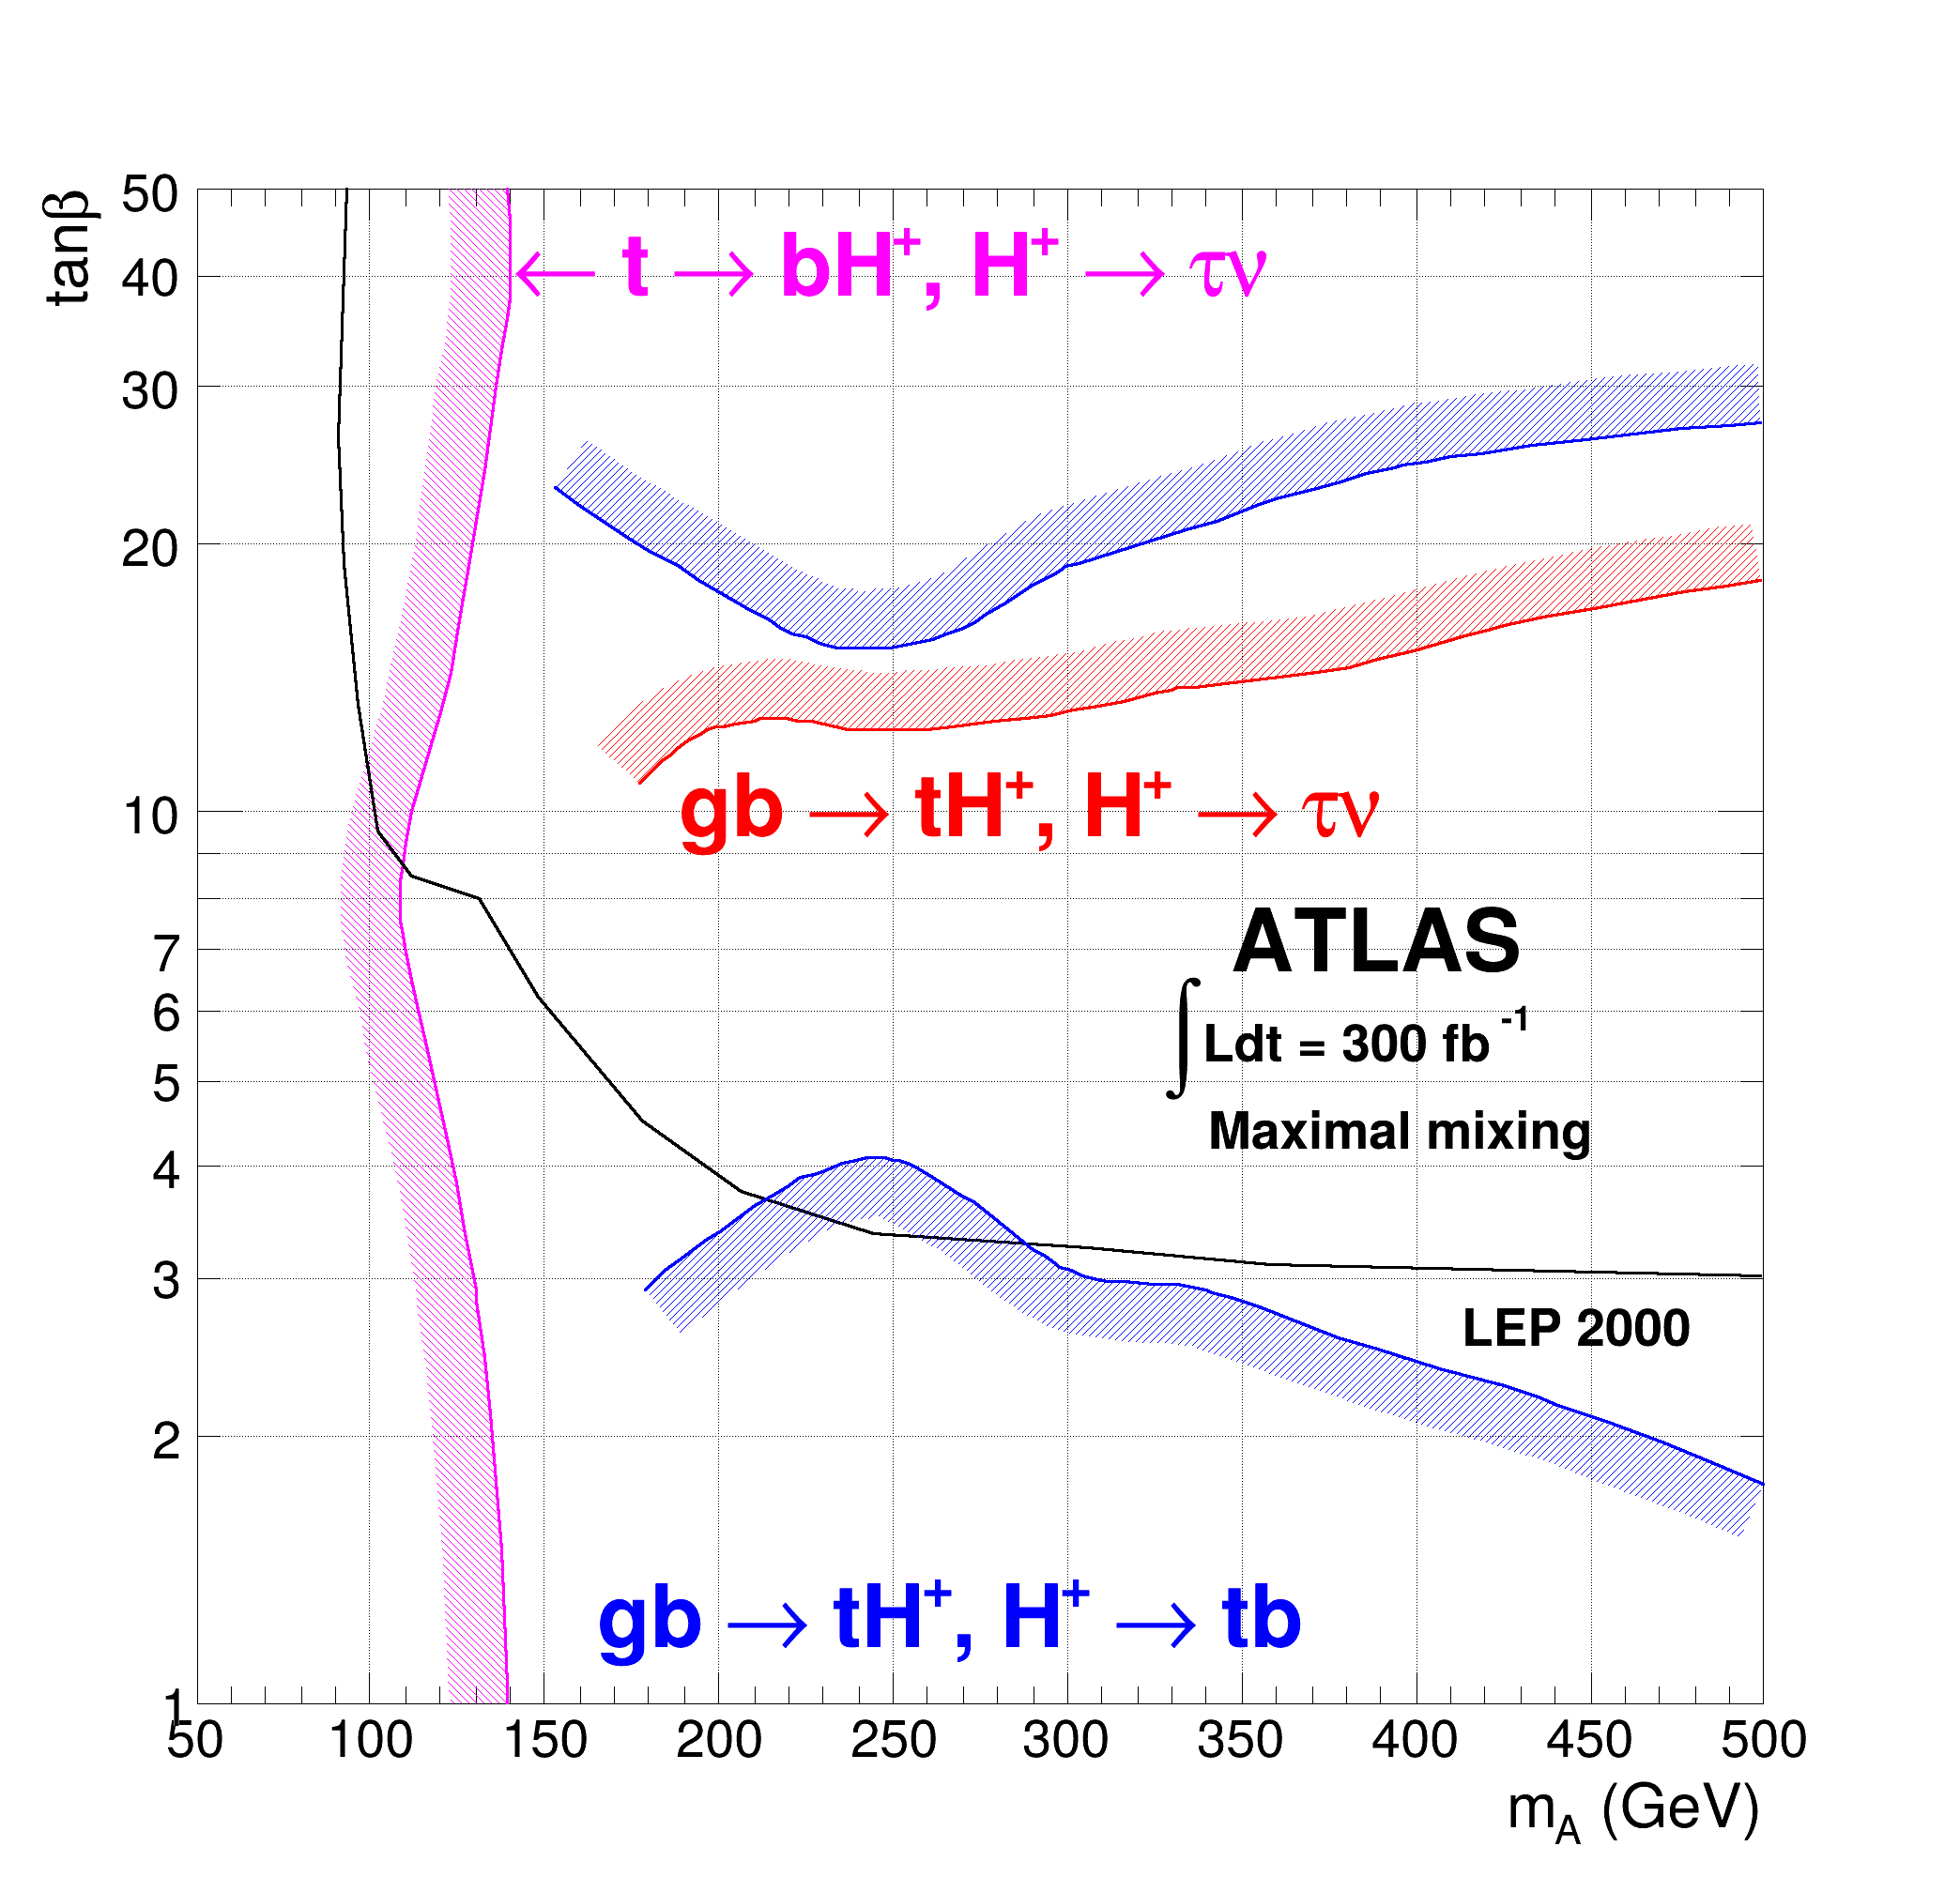
 Draw several graphs with exclusion zones.
The shaded areas are obtained with a fill for the graph and controlled with SetLineWidth. SetLineWidth for exclusion graphs is explained in the TGraphPainter documentation
The graphs are drawn superposed, with help of an empty histogram that defines the axes, so we must make sure that the axis limits are adequate for all graphs. Notice that only the first drawn graph needs the "A" (draw axes) option. Alternatively, one could add the graphs to a TMultiGraph, which automatically defines the appropriate limits; see the gr106_exclusiongraph.C tutorial.
We add some text to the plot with TLatex. Notice that the TLatex text is drawn on the current pad/canvas and does not need, nor have, a "same" option.
void gr107_exclusiongraph2()
{
TH1 *frame =
new TH1F(
"frame",
"",1000,50,500);
frame->SetMinimum(1);
frame->SetMaximum(50);
frame->SetDirectory(0);
frame->SetStats(0);
frame->GetXaxis()->SetTitle("m_{A} (GeV)");
frame->GetXaxis()->SetTickLength(0.02);
frame->GetXaxis()->SetLabelSize(0.03);
frame->GetYaxis()->SetTitle("tan#beta");
frame->GetYaxis()->SetMoreLogLabels();
frame->GetYaxis()->SetLabelSize(0.03);
frame->Draw(" ");
"#leftarrow t #rightarrow bH^{+}, H^{+} #rightarrow #tau#nu");
tex =
new TLatex(346.929,6.62281,
"ATLAS");
tex =
new TLatex(328.341,5.24703,
"#intLdt = 300 fb^{-1}");
tex =
new TLatex(340.463,4.1874,
"Maximal mixing");
tex =
new TLatex(413.2,2.51608,
"LEP 2000");
tex =
new TLatex(188.151,9.36035,
"gb #rightarrow tH^{+}, H^{+} #rightarrow #tau#nu");
tex =
new TLatex(165.,1.15498,
"gb #rightarrow tH^{+}, H^{+} #rightarrow tb");
}
virtual void SetFillColor(Color_t fcolor)
Set the fill area color.
virtual void SetFillStyle(Style_t fstyle)
Set the fill area style.
virtual void SetLineWidth(Width_t lwidth)
Set the line width.
virtual void SetLineColor(Color_t lcolor)
Set the line color.
virtual void SetTextColor(Color_t tcolor=1)
Set the text color.
virtual void SetTextSize(Float_t tsize=1)
Set the text size.
virtual void SetPoint(Int_t i, Double_t x, Double_t y)
void SetName(const char *name="") override
Set the name of the TNamed.
void Draw(Option_t *chopt="") override
Default Draw method for all objects.
void SetTitle(const char *title="") override
Set the title of the TNamed.
1-D histogram with a float per channel (see TH1 documentation)
TH1 is the base class of all histogram classes in ROOT.
virtual void Draw(Option_t *option="")
Default Draw method for all objects.
- Author
- Olivier Couet
Definition in file gr107_exclusiongraph2.C.

