

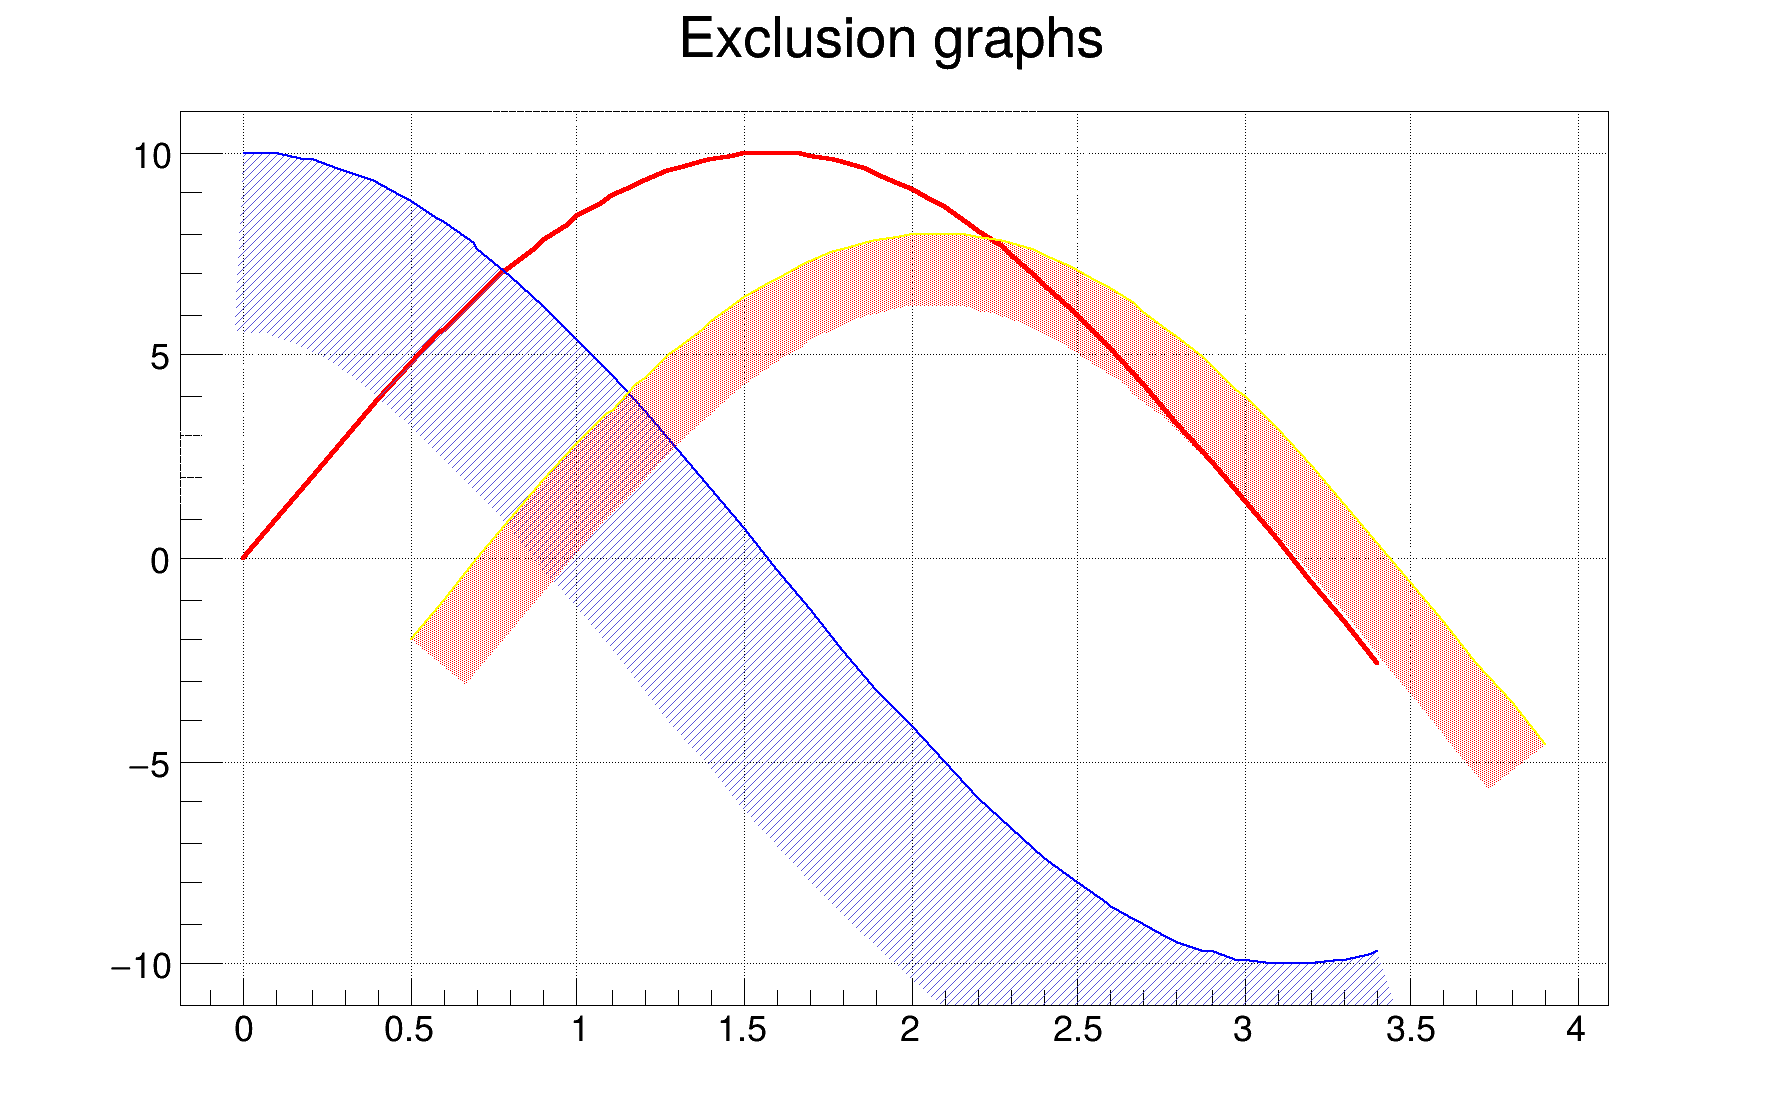
 Draw three graphs with an exclusion zone.
The shaded areas are obtained with a fill for the graph and controlled with SetLineWidth. SetLineWidth for exclusion graphs is explained in the TGraphPainter documentation
As the graphs will be superposed on drawing, we add them to a TMultiGraph and then draw this one.
Double_t xvalues1[
n], xvalues2[
n], xvalues3[
n], yvalues1[
n], yvalues2[
n], yvalues3[
n];
xvalues1[i] = i*0.1;
xvalues2[i] = xvalues1[i];
xvalues3[i] = xvalues1[i]+.5;
yvalues1[i] = 10*sin(xvalues1[i]);
yvalues2[i] = 10*cos(xvalues1[i]);
yvalues3[i] = 10*sin(xvalues1[i])-2;
}
}
int Int_t
Signed integer 4 bytes (int).
double Double_t
Double 8 bytes.
virtual void SetFillColor(Color_t fcolor)
Set the fill area color.
virtual void SetFillStyle(Style_t fstyle)
Set the fill area style.
virtual void SetLineWidth(Width_t lwidth)
Set the line width.
virtual void SetLineColor(Color_t lcolor)
Set the line color.
virtual void Add(TGraph *graph, Option_t *chopt="")
void Draw(Option_t *chopt="") override
Default Draw method for all objects.
virtual void SetTitle(const char *title="")
Set the title of the TNamed.
- Author
- Olivier Couet
Definition in file gr106_exclusiongraph.C.

