class TGaxis: public TLine, public TAttText
The axis painter class
- Basic definition
- Definition with a function
- Logarithmic axis
- Blank axis
- Tick marks' orientation
- Tick marks' size
- Labels' positionning
- Labels' orientation
- Labels' position on tick marks
- Labels' format
- Alphanumeric labels
- Number of divisions optimisation
- Maximum Number of Digits for the axis labels
- Optional grid
- Time axis
Basic definition
A TGaxis is defined the following way:
TGaxis::TGaxis(Double_t xmin, Double_t ymin, Double_t xmax, Double_t ymax,
               Double_t wmin, Double_t wmax, Int_t ndiv, Option_t *chopt,
               Double_t gridlength)
Where:
- xmin : X origin coordinate in user's coordinates space.
- xmax : X end axis coordinate in user's coordinates space.
- ymin : Y origin coordinate in user's coordinates space.
- ymax : Y end axis coordinate in user's coordinates space.
- wmin : Lowest value for the tick mark labels written on the axis.
- wmax : Highest value for the tick mark labels written on the axis.
- ndiv : Number of divisions.
- ndiv=N1 + 100*N2 + 10000*N3
- N1=number of 1st divisions.
- N2=number of 2nd divisions.
- N3=number of 3rd divisions. e.g.:
- ndiv=0 --> no tick marks.
- ndiv=2 --> 2 divisions, one tick mark in the middle of the axis.
- chopt : Drawing options (see below).
- gridlength: grid length on main tick marks.

{
   TCanvas *c1 = new TCanvas("c1","Examples of TGaxis",10,10,700,500);

   c1->Range(-10,-1,10,1);

   TGaxis *axis1 = new TGaxis(-4.5,-0.2,5.5,-0.2,-6,8,510,"");
   axis1->SetName("axis1");
   axis1->Draw();

   TGaxis *axis2 = new TGaxis(-4.5,0.2,5.5,0.2,0.001,10000,510,"G");
   axis2->SetName("axis2");
   axis2->Draw();

   TGaxis *axis3 = new TGaxis(-9,-0.8,-9,0.8,-8,8,50510,"");
   axis3->SetName("axis3");
   axis3->Draw();

   TGaxis *axis4 = new TGaxis(-7,-0.8,-7,0.8,1,10000,50510,"G");
   axis4->SetName("axis4");
   axis4->Draw();

   TGaxis *axis5 = new TGaxis(-4.5,-0.6,5.5,-0.6,1.2,1.32,80506,"-+");
   axis5->SetName("axis5");
   axis5->SetLabelSize(0.03);
   axis5->SetTextFont(72);
   axis5->SetLabelOffset(0.025);

   axis5->Draw();

   TGaxis *axis6 = new TGaxis(-4.5,0.6,5.5,0.6,100,900,50510,"-");
   axis6->SetName("axis6");
   axis6->Draw();

   TGaxis *axis7 = new TGaxis(8,-0.8,8,0.8,0,9000,50510,"+L");
   axis7->SetName("axis7");
   axis7->SetLabelOffset(0.01);
   axis7->Draw();

   //one can make axis going top->bottom. However because of a long standing
   //problem, the two x values should not be equal
   TGaxis *axis8 = new TGaxis(6.5,0.8,6.499,-0.8,0,90,50510,"-");
   axis8->SetName("axis8");
   axis8->Draw();
   return c1;
}
Definition with a function
Instead of the wmin,wmax arguments of the normal definition, the name of a TF1 function can be specified. This function will be used to map the user coordinates to the axis values and ticks. A TGaxis is defined the following way:
TGaxis::TGaxis(Double_t xmin, Double_t ymin, Double_t xmax, Double_t ymax,
               const char *func, Int_t ndiv,   Option_t *chopt,
               Double_t gridlength)
Where:
- xmin : X origin coordinate in user's coordinates space.
- xmax : X end axis coordinate in user's coordinates space.
- ymin : Y origin coordinate in user's coordinates space.
- ymax : Y end axis coordinate in user's coordinates space.
- func : function defining axis labels and tick marks.
- ndiv : Number of divisions.
- ndiv=N1 + 100*N2 + 10000*N3
- N1=number of 1st divisions.
- N2=number of 2nd divisions.
- N3=number of 3rd divisions. e.g.:
- ndiv=0 --> no tick marks.
- ndiv=2 --> 2 divisions, one tick mark in the middle of the axis.
- chopt : Drawing options (see below).
- gridlength: grid length on main tick marks.
Examples:

{
   TCanvas *c2 = new TCanvas("c2","c2",10,10,700,500);

   gStyle->SetOptStat(0);

   TH2F *h2 = new TH2F("h","Axes",100,0,10,100,-2,2);
   h2->Draw();

   TF1 *f1=new TF1("f1","-x",-10,10);
   TGaxis *A1 = new TGaxis(0,2,10,2,"f1",510,"-");
   A1->SetTitle("axis with decreasing values");
   A1->Draw();

   TF1 *f2=new TF1("f2","exp(x)",0,2);
   TGaxis *A2 = new TGaxis(1,1,9,1,"f2");
   A2->SetTitle("exponential axis");
   A2->SetLabelSize(0.03);
   A2->SetTitleSize(0.03);
   A2->SetTitleOffset(1.2);
   A2->Draw();

   TF1 *f3=new TF1("f3","log10(x)",1,1000);
   TGaxis *A3 = new TGaxis(2,-2,2,0,"f3",505,"G");
   A3->SetTitle("logarithmic axis");
   A3->SetLabelSize(0.03);
   A3->SetTitleSize(0.03);
   A3->SetTitleOffset(1.2);
   A3->Draw();
   return c2;
}
Logarithmic axis
By default axis are linear. To define a TGaxis as logarithmic, it is enough to create it with the option "G".When plotting an histogram or a graph the logarithmic scale can be set using:
- gPad->SetLogx(1); set the logarithmic scale on the X axis
- gPad->SetLogy(1); set the logarithmic scale on the Y axis
Blank axis
To draw only the axis tick marks without the axis body, it is enough to specify the option "B". It useful to superpose axis.Tick marks' orientation
By default tick marks are drawn on the positive side of the axis, except for vertical axis for which the default is negative. The chop parameter allows to control the tick marks orientation:- chopt = "+": tick marks are drawn on Positive side. (default)
- chopt ="-": tick mark are drawn on the negative side.
- chopt = "+-": tick marks are drawn on both sides of the axis.
- chopt = "U": Unlabelled axis, default is labeled.
Tick marks' size
By default, tick marks have a length equal to 3 per cent of the axis length. When the option "S" is specified, the length of the tick marks is equal to fTickSize*axis_length, where fTickSize may be set via TGaxis::SetTickSize.When plotting an histogram h the tick marks size can be changed using:
- h->GetXaxis()->SetTickLength(0.02); set the tick length for the X axis
- gStyle->SetTickLength(0.02,"x"); set the tick length for the X axis of all histograms drawn after this instruction.
A good way to remove tick marks on an axis is to set the tick length to 0: h->GetXaxis()->SetTickLength(0.);
Labels' positionning
Labels are normally drawn on side opposite to tick marks. However the option "=" allows to draw them on the same side.Labels' orientation
By default axis labels are drawn parallel to the axis. However if the axis is vertical then are drawn perpendicular to the axis.Labels' position on tick marks
By default axis labels are centered on tick marks. However, for vertical axis, they are right adjusted. The chop parameter allows to control the labels' position on tick marks:- chopt = "R": labels are Right adjusted on tick mark.(default is centered)
- chopt = "L": labels are Left adjusted on tick mark.
- chopt = "C": labels are Centered on tick mark.
- chopt = "M": In the Middle of the divisions.
Labels' format
Blank characters are stripped, and then the label is correctly aligned. the dot, if last character of the string, is also stripped, unless the option "." (a dot, or period) is specified. if SetDecimals(kTRUE) has been called all labels have the same number of decimals after the "." The same is true if gStyle->SetStripDecimals(kFALSE) has been called.In the following, we have some parameters, like tick marks length and characters height (in percentage of the length of the axis (user's coordinates)) The default values are as follows:
- Primary tick marks: 3.0 %
- Secondary tick marks: 1.5 %
- Third order tick marks: .75 %
- Characters height for labels: 4%
- Labels offset: 1.0 %
By default, an exponent of the form 10^N is used when the label values are either all very small or very large. One can disable the exponent by calling axis.SetNoExponent(kTRUE).
TGaxis::SetExponentOffset(Float_t xoff, Float_t yoff, Option_t *axis) is static function to set X and Y offset of the axis 10^n notation. It is in % of the pad size. It can be negative. axis specifies which axis ("x" or/and "y"), default is "x" if axis = "xz" set the two axes
Alphanumeric labels
Axis labels can be any alphanumeric character strings. Such axis can be produced only with histograms because the labels'definition is stored in TAxis. The following example demonstrates how to create such labels.
// 2-D histograms with alphanumeric labels
// author; Rene Brun
TCanvas *hlabels2()
{
   const Int_t nx = 12;
   const Int_t ny = 20;
   const char *month[nx]  = {"January","February","March","April","May",
      "June","July","August","September","October","November",
      "December"};
   const char *people[ny] = {"Jean","Pierre","Marie","Odile","Sebastien",
      "Fons","Rene","Nicolas","Xavier","Greg","Bjarne","Anton",
      "Otto","Eddy","Peter","Pasha","Philippe","Suzanne","Jeff",
      "Valery"};
   TCanvas *c1 = new TCanvas("c1","demo bin labels",10,10,600,600);
   c1->SetGrid();
   c1->SetLeftMargin(0.15);
   c1->SetBottomMargin(0.15);
   TH2F *h = new TH2F("h","test",3,0,3,2,0,2);
   h->SetCanExtend(TH1::kAllAxes);
   h->SetStats(0);
   gRandom->SetSeed();
   for (Int_t i=0;i<15000;i++) {
      Int_t rx = gRandom->Rndm()*nx;
      Int_t ry = gRandom->Rndm()*ny;
      h->Fill(people[ry],month[rx],1);
   }
   h->LabelsDeflate("X");
   h->LabelsDeflate("Y");
   h->LabelsOption("v");
   h->Draw("text");

   TPaveText *pt = new TPaveText(0.6,0.85,0.98,0.98,"brNDC");
   pt->SetFillColor(18);
   pt->SetTextAlign(12);
   pt->AddText("Use the axis Context Menu LabelsOption");
   pt->AddText(" \"a\"   to sort by alphabetic order");
   pt->AddText(" \">\"   to sort by decreasing values");
   pt->AddText(" \"<\"   to sort by increasing values");
   pt->Draw();
   return c1;
}
Because the alphanumeric labels are usually longer that the numeric labels, their size is by default equal to 0.66666 * the_numeric_labels_size.
Number of divisions optimisation
By default the number of divisions on axis is optimised to show a coherent labelling of the main tick marks. The number of division (ndiv) is a composite integer given by:ndiv = N1 + 100*N2 + 10000*N3
- N1 = number of 1st divisions.
- N2 = number of 2nd divisions.
- N3 = number of 3rd divisions.
On an histogram pointer h the number of divisions can be set in different ways:.
- Directly on the histogram. The following will set the number of division
to 510 on the X axis of
h. To avoid optimization the number of divisions should be negative (ie: -510); h->SetNdivisions(510, "X");
- On the axis itself:
h->GetXaxis()->SetNdivisions(510, kTRUE);
The first parameter is the number of division. If it is negative of if the second parameter is kFALSE then the number of divisions is not optimised. And other signature is also allowed:h->GetXaxis()->SetNdivisions(10, 5, 0, kTRUE);
- On the axis itself:
Maximum Number of Digits for the axis labels
The static function TGaxis::SetMaxDigits sets the maximum number of digits permitted for the axis labels above which the notation with 10^N is used. For example, to accept 6 digits number like 900000 on an axis call TGaxis::SetMaxDigits(6). The default value is 5. fgMaxDigits must be greater than 0.Optional grid
The option "W" allows to draw a grid on the primary tick marks. In case of a log axis, the grid is only drawn for the primary tick marks if the number of secondary and tertiary divisions is 0. SetGridLength() allows to define the length of the grid.When plotting an histogram or a graph the grid can be set ON or OFF using:
- gPad->SetGridy(1); set the grid on the X axis
- gPad->SetGridx(1); set the grid on the Y axis
- gPad->SetGrid(1,1); set the grid on both axis.
Time axis
Axis labels may be considered as times, plotted in a defined time format. The format is set with SetTimeFormat(). The TGaxis minimum (wmin) and maximum (wmax) values are considered as two time values in seconds. The time axis will be spread around the time offset value (set with SetTimeOffset()). Actually it will go from TimeOffset+wminto TimeOffset+wmaxUsually time axis are created automatically via histograms, but one may also want to draw a time axis outside an "histogram context". This can be done thanks to the option "T" of TGaxis.

{
   c1 = new TCanvas("c1","Examples of TGaxis",10,10,700,100);
   c1->Range(-10,-1,10,1);

   TGaxis *axis = new TGaxis(-8,0.,8,0.,-100000,150000,2405,"tS");
   axis->SetLabelSize(0.3);
   axis->SetTickSize(0.2);

   TDatime da(2003,02,28,12,00,00);
   axis->SetTimeOffset(da.Convert());
   axis->SetTimeFormat("%d-%m-%Y");
   axis->Draw();
   return c1;
}
The following example compares what the system time function gmtime and localtime give with what gives TGaxis. It can be used as referenced test to check if the time option of TGaxis is working properly.

// This example compares what the system time function gmtime and localtime give
// with what gives TGaxis. It can be used as referenced test to check if TGaxis
// is working properly.
// The original code was developped by Philippe Gras (CEA Saclay. IRFU/SEDI)
//Author: Philippe Gras, Bertrand Bellenot, Olivier Couet

#if defined(G__WIN32) && defined(__CINT__) && !defined(__MAKECINT__)
{
   // timeonaxis3.C has to be run in compiled mode on Windows.
   // the following code does it.

   gSystem->CompileMacro("timeonaxis3.C");
   timeonaxis3();
}
#else

#include "TAxis.h"
#include "TGaxis.h"
#include "TCanvas.h"
#include "TString.h"
#include "TLine.h"
#include "TLatex.h"
#include <time.h>
#include <stdio.h>

TString stime(time_t* t, bool utc = false, bool display_time_zone = true) {
   struct tm* tt;
   if (utc) tt = gmtime(t);
   else     tt = localtime(t);
   char buf[256];
   if (display_time_zone) strftime(buf, sizeof(buf), "%H:%M:%S %Z", tt);
   else                   strftime(buf, sizeof(buf), "%Y-%m-%d %H:%M:%S", tt);
   return TString(buf);
}


TCanvas * timeonaxis3() {
   double f = 1.8;

   TCanvas* c = new TCanvas;

   TLatex* tex1 = new TLatex;
   tex1->SetNDC();
   tex1->SetTextFont(102);
   tex1->SetTextSize(0.07*f);

   TLatex* tex3 = new TLatex;
   tex3->SetNDC();
   tex3->SetTextFont(102);
   tex3->SetTextSize(0.07*f);
   tex3->SetTextColor(kBlue+2);

   TLatex* tex2 = new TLatex;
   tex2->SetNDC();
   tex2->SetTextFont(102);
   tex2->SetTextSize(0.07*f);
   tex2->SetTextColor(kOrange+3);

   time_t offset[] = {0,                   0, 1325376000, 1341100800};
   time_t t[]      = {1331150400, 1336417200,          0, 36000};

   c->SetTopMargin(0); c->SetBottomMargin(0);
   c->SetLeftMargin(0); c->SetRightMargin(0);
   c->Divide(2, 4, -1, -1);
   TLine l;
   l.DrawLine(0.5, 0, 0.5, 1.);

   for(int i = 0; i < 4; ++i){
      for(int gmt = 0; gmt < 2; ++gmt){
         const char* opt = (gmt ? "gmt" : "local");
         TVirtualPad* p = c->cd(2*i + gmt + 1);
         p->SetTopMargin(0); p->SetBottomMargin(0);
         p->SetLeftMargin(0); p->SetRightMargin(0);
         p->SetFillStyle(4000);

         TGaxis* ga = new TGaxis (.4, .25, 5., .25, t[i], t[i] + 1,  1, "t");
         ga->SetTimeFormat("TGaxis label: #color[2]{%Y-%m-%d %H:%M:%S}");
         ga->SetLabelFont(102);
         ga->SetLabelColor(kBlue+2);

         ga->SetTimeOffset(offset[i], opt);
         ga->SetLabelOffset(0.04*f);
         ga->SetLabelSize(0.07*f);
         ga->SetLineColor(0);
         ga->Draw();

         // Get offset string of axis time format: there is not acccessor
         // to time format in TGaxis.
         // Assumes TAxis use the same format.
         TAxis a(10, 0, 1600000000);
         a.SetTimeOffset(offset[i], opt);
         const char* offsettimeformat = a.GetTimeFormat();

         char buf[256];
         if (offset[i] < t[i]) {
            sprintf(buf, "#splitline{%s, %s}{offset: %ld, option %s}",
                    stime(t+i).Data(), stime(t+i, true).Data(), offset[i], opt);
         } else {
            int h = t[i] / 3600;
            int m = (t[i] - 3600 * h) / 60 ;
            int s = (t[i] - h * 3600 - m * 60);
            sprintf(buf, "#splitline{%d h %d m %d s}{offset: %s, option %s}",
                    h, m, s, stime(offset + i, gmt).Data(), opt);
         }
         tex1->DrawLatex(.01, .75, buf);
         tex2->DrawLatex(.01, .50, offsettimeformat);
         time_t t_ = t[i] + offset[i];
         sprintf(buf, "Expecting:    #color[2]{%s}", stime(&t_, gmt, false).Data());
         tex3->DrawLatex(.01, .24, buf);
         if(i > 0) l.DrawLine(0, 0.95, 1, 0.95);
      }
   }
   return c;
}
#endif
The following macro illustrates the use, with histograms axis, of the time mode on the axis with different time intervals and time formats.

#include <time.h>

TCanvas *timeonaxis()
{
// This macro illustrates the use of the time mode on the axis
// with different time intervals and time formats. It's result can
// be seen begin_html <a href="gif/timeonaxis.gif">here</a> end_html
// Through all this script, the time is expressed in UTC. some
// information about this format (and others like GPS) may be found at
// begin_html <a href="http://tycho.usno.navy.mil/systime.html">http://tycho.usno.navy.mil/systime.html</a> end_html
//  or
// begin_html <a href="http://www.topology.org/sci/time.html">http://www.topology.org/sci/time.html</a> end_html
//
// The start time is : almost NOW (the time at which the script is executed)
// actualy, the nearest preceding hour beginning.
// The time is in general expressed in UTC time with the C time() function
// This will obviously most of the time not be the time displayed on your watch
// since it is universal time. See the C time functions for converting this time
// into more useful structures.
//Author: Damir Buskulic

   time_t script_time;
   script_time = time(0);
   script_time = 3600*(int)(script_time/3600);

// The time offset is the one that will be used by all graphs.
// If one changes it, it will be changed even on the graphs already defined
   gStyle->SetTimeOffset(script_time);

   TCanvas *ct = new TCanvas("ct","Time on axis",10,10,700,900);
   ct->Divide(1,3);
   ct->SetFillColor(28);

   int i;

//======= Build a signal : noisy damped sine ======
//        Time interval : 30 minutes

   gStyle->SetTitleH(0.08);
   float noise;
   TH1F *ht = new TH1F("ht","Love at first sight",3000,0.,2000.);
   for (i=1;i<3000;i++) {
      noise = gRandom->Gaus(0,120);
      if (i>700) {
         noise += 1000*sin((i-700)*6.28/30)*exp((double)(700-i)/300);
      }
      ht->SetBinContent(i,noise);
   }
   ct->cd(1);
   gPad->SetFillColor(41);
   gPad->SetFrameFillColor(33);
   ht->SetLineColor(2);
   ht->GetXaxis()->SetLabelSize(0.05);
   ht->Draw();
// Sets time on the X axis
// The time used is the one set as time offset added to the value
// of the axis. This is converted into day/month/year hour:min:sec and
// a reasonnable tick interval value is chosen.
   ht->GetXaxis()->SetTimeDisplay(1);

//======= Build a simple graph beginning at a different time ======
//        Time interval : 5 seconds

   float x[100], t[100];
   for (i=0;i<100;i++) {
      x[i] = sin(i*4*3.1415926/50)*exp(-(double)i/20);
      t[i] = 6000+(double)i/20;
   }
   TGraph *gt = new TGraph(100,t,x);
   gt->SetTitle("Politics");
   ct->cd(2);
   gPad->SetFillColor(41);
   gPad->SetFrameFillColor(33);
   gt->SetFillColor(19);
   gt->SetLineColor(5);
   gt->SetLineWidth(2);
   gt->Draw("AL");
   gt->GetXaxis()->SetLabelSize(0.05);
// Sets time on the X axis
   gt->GetXaxis()->SetTimeDisplay(1);
   gPad->Modified();

//======= Build a second simple graph for a very long time interval ======
//        Time interval : a few years

   float x2[10], t2[10];
   for (i=0;i<10;i++) {
      x2[i] = gRandom->Gaus(500,100)*i;
      t2[i] = i*365*86400;
   }
   TGraph *gt2 = new TGraph(10,t2,x2);
   gt2->SetTitle("Number of monkeys on the moon");
   ct->cd(3);
   gPad->SetFillColor(41);
   gPad->SetFrameFillColor(33);
   gt2->SetFillColor(19);
   gt2->SetMarkerColor(4);
   gt2->SetMarkerStyle(29);
   gt2->SetMarkerSize(1.3);
   gt2->Draw("AP");
   gt2->GetXaxis()->SetLabelSize(0.05);
// Sets time on the X axis
   gt2->GetXaxis()->SetTimeDisplay(1);
//
// One can choose a different time format than the one chosen by default
// The time format is the same as the one of the C strftime() function
// It's a string containing the following formats :
//    for date :
//      %a abbreviated weekday name
//      %b abbreviated month name
//      %d day of the month (01-31)
//      %m month (01-12)
//      %y year without century
//      %Y year with century
//
//    for time :
//      %H hour (24-hour clock)
//      %I hour (12-hour clock)
//      %p local equivalent of AM or PM
//      %M minute (00-59)
//      %S seconds (00-61)
//      %% %
// The other characters are output as is.

   gt2->GetXaxis()->SetTimeFormat("y. %Y %F2000-01-01 00:00:00");
   gPad->Modified();
   return ct;
}
An other example showing how to define the time offset as 2003, January 1st using histograms axis.

TCanvas *timeonaxis2() {
   // Define the time offset as 2003, January 1st
   //Author: Olivier Couet

   TCanvas *ct2 = new TCanvas("ct2","ct2",10,10,700,500);

   TDatime T0(2003, 1, 1, 0, 0, 0);
   int X0 = T0.Convert();
   gStyle->SetTimeOffset(X0);

   // Define the lowest histogram limit as 2002, September 23rd
   TDatime T1(2002, 9, 23, 0, 0, 0);
   int X1 = T1.Convert()-X0;

   // Define the highest histogram limit as 2003, March 7th
   TDatime T2(2003, 3, 7, 0, 0, 0);
   int X2 = T2.Convert(1)-X0;

   TH1F * h1 = new TH1F("h1","test",100,X1,X2);

   TRandom r;
   for (Int_t i=0;i<30000;i++) {
      Double_t noise = r.Gaus(0.5*(X1+X2),0.1*(X2-X1));
      h1->Fill(noise);
   }

   h1->GetXaxis()->SetTimeDisplay(1);
   h1->GetXaxis()->SetLabelSize(0.03);
   h1->GetXaxis()->SetTimeFormat("%Y/%m/%d");
   h1->Draw();
   return ct2;
}
Function Members (Methods)
| virtual | ~TGaxis() |
| void | TObject::AbstractMethod(const char* method) const |
| virtual void | AdjustBinSize(Double_t A1, Double_t A2, Int_t nold, Double_t& BinLow, Double_t& BinHigh, Int_t& nbins, Double_t& BinWidth) |
| virtual void | TObject::AppendPad(Option_t* option = "") |
| virtual void | TObject::Browse(TBrowser* b) |
| virtual void | CenterLabels(Bool_t center = kTRUE) |
| virtual void | CenterTitle(Bool_t center = kTRUE) |
| static TClass* | Class() |
| virtual const char* | TObject::ClassName() const |
| virtual void | TObject::Clear(Option_t* = "") |
| virtual TObject* | TObject::Clone(const char* newname = "") const |
| virtual Int_t | TObject::Compare(const TObject* obj) const |
| virtual void | TLine::Copy(TObject& line) const |
| virtual void | TObject::Delete(Option_t* option = "")MENU |
| Int_t | TAttLine::DistancetoLine(Int_t px, Int_t py, Double_t xp1, Double_t yp1, Double_t xp2, Double_t yp2) |
| virtual Int_t | TLine::DistancetoPrimitive(Int_t px, Int_t py) |
| virtual void | TObject::Draw(Option_t* option = "") |
| virtual void | DrawAxis(Double_t xmin, Double_t ymin, Double_t xmax, Double_t ymax, Double_t wmin, Double_t wmax, Int_t ndiv = 510, Option_t* chopt = "", Double_t gridlength = 0) |
| virtual void | TObject::DrawClass() constMENU |
| virtual TObject* | TObject::DrawClone(Option_t* option = "") constMENU |
| virtual TLine* | TLine::DrawLine(Double_t x1, Double_t y1, Double_t x2, Double_t y2) |
| virtual TLine* | TLine::DrawLineNDC(Double_t x1, Double_t y1, Double_t x2, Double_t y2) |
| virtual void | TObject::Dump() constMENU |
| virtual void | TObject::Error(const char* method, const char* msgfmt) const |
| virtual void | TObject::Execute(const char* method, const char* params, Int_t* error = 0) |
| virtual void | TObject::Execute(TMethod* method, TObjArray* params, Int_t* error = 0) |
| virtual void | TLine::ExecuteEvent(Int_t event, Int_t px, Int_t py) |
| virtual void | TObject::Fatal(const char* method, const char* msgfmt) const |
| virtual TObject* | TObject::FindObject(const char* name) const |
| virtual TObject* | TObject::FindObject(const TObject* obj) const |
| virtual Rectangle_t | TLine::GetBBox() |
| virtual TPoint | TLine::GetBBoxCenter() |
| virtual Option_t* | TObject::GetDrawOption() const |
| static Long_t | TObject::GetDtorOnly() |
| TF1* | GetFunction() const |
| Float_t | GetGridLength() const |
| virtual const char* | TObject::GetIconName() const |
| Int_t | GetLabelColor() const |
| Int_t | GetLabelFont() const |
| Float_t | GetLabelOffset() const |
| Float_t | GetLabelSize() const |
| virtual Color_t | TAttLine::GetLineColor() const |
| virtual Style_t | TAttLine::GetLineStyle() const |
| virtual Width_t | TAttLine::GetLineWidth() const |
| static Int_t | GetMaxDigits() |
| virtual const char* | GetName() const |
| Int_t | GetNdiv() const |
| virtual char* | TObject::GetObjectInfo(Int_t px, Int_t py) const |
| static Bool_t | TObject::GetObjectStat() |
| virtual const char* | GetOption() const |
| virtual Short_t | TAttText::GetTextAlign() const |
| virtual Float_t | TAttText::GetTextAngle() const |
| virtual Color_t | TAttText::GetTextColor() const |
| virtual Font_t | TAttText::GetTextFont() const |
| virtual Float_t | TAttText::GetTextSize() const |
| Float_t | GetTickSize() const |
| virtual const char* | GetTitle() const |
| Float_t | GetTitleOffset() const |
| Float_t | GetTitleSize() const |
| virtual UInt_t | TObject::GetUniqueID() const |
| Double_t | GetWmax() const |
| Double_t | GetWmin() const |
| Double_t | TLine::GetX1() const |
| Double_t | TLine::GetX2() const |
| Double_t | TLine::GetY1() const |
| Double_t | TLine::GetY2() const |
| virtual Bool_t | TObject::HandleTimer(TTimer* timer) |
| virtual ULong_t | TObject::Hash() const |
| virtual void | ImportAxisAttributes(TAxis* axis) |
| virtual void | TObject::Info(const char* method, const char* msgfmt) const |
| virtual Bool_t | TObject::InheritsFrom(const char* classname) const |
| virtual Bool_t | TObject::InheritsFrom(const TClass* cl) const |
| virtual void | TObject::Inspect() constMENU |
| void | TObject::InvertBit(UInt_t f) |
| virtual TClass* | IsA() const |
| virtual Bool_t | TObject::IsEqual(const TObject* obj) const |
| virtual Bool_t | TObject::IsFolder() const |
| Bool_t | TLine::IsHorizontal() |
| Bool_t | TObject::IsOnHeap() const |
| virtual Bool_t | TObject::IsSortable() const |
| Bool_t | TLine::IsVertical() |
| Bool_t | TObject::IsZombie() const |
| void | LabelsLimits(const char* label, Int_t& first, Int_t& last) |
| virtual void | TLine::ls(Option_t* option = "") const |
| void | TObject::MayNotUse(const char* method) const |
| virtual void | TAttLine::Modify() |
| virtual Bool_t | TObject::Notify() |
| void | TObject::Obsolete(const char* method, const char* asOfVers, const char* removedFromVers) const |
| void | TObject::operator delete(void* ptr) |
| void | TObject::operator delete(void* ptr, void* vp) |
| void | TObject::operator delete[](void* ptr) |
| void | TObject::operator delete[](void* ptr, void* vp) |
| void* | TObject::operator new(size_t sz) |
| void* | TObject::operator new(size_t sz, void* vp) |
| void* | TObject::operator new[](size_t sz) |
| void* | TObject::operator new[](size_t sz, void* vp) |
| virtual void | Paint(Option_t* chopt = "") |
| virtual void | PaintAxis(Double_t xmin, Double_t ymin, Double_t xmax, Double_t ymax, Double_t& wmin, Double_t& wmax, Int_t& ndiv, Option_t* chopt = "", Double_t gridlength = 0, Bool_t drawGridOnly = kFALSE) |
| virtual void | TLine::PaintLine(Double_t x1, Double_t y1, Double_t x2, Double_t y2) |
| virtual void | TLine::PaintLineNDC(Double_t u1, Double_t v1, Double_t u2, Double_t v2) |
| virtual void | TObject::Pop() |
| virtual void | TLine::Print(Option_t* option = "") const |
| virtual Int_t | TObject::Read(const char* name) |
| virtual void | TObject::RecursiveRemove(TObject* obj) |
| virtual void | TAttLine::ResetAttLine(Option_t* option = "") |
| virtual void | TAttText::ResetAttText(Option_t* toption = "") |
| void | TObject::ResetBit(UInt_t f) |
| virtual void | Rotate(Double_t X, Double_t Y, Double_t CFI, Double_t SFI, Double_t XT, Double_t YT, Double_t& U, Double_t& V) |
| virtual void | TObject::SaveAs(const char* filename = "", Option_t* option = "") constMENU |
| virtual void | TAttLine::SaveLineAttributes(ostream& out, const char* name, Int_t coldef = 1, Int_t stydef = 1, Int_t widdef = 1) |
| virtual void | SavePrimitive(ostream& out, Option_t* option = "") |
| virtual void | TAttText::SaveTextAttributes(ostream& out, const char* name, Int_t alidef = 12, Float_t angdef = 0, Int_t coldef = 1, Int_t fondef = 61, Float_t sizdef = 1) |
| virtual void | TLine::SetBBoxCenter(const TPoint& p) |
| virtual void | TLine::SetBBoxCenterX(const Int_t x) |
| virtual void | TLine::SetBBoxCenterY(const Int_t y) |
| virtual void | TLine::SetBBoxX1(const Int_t x) |
| virtual void | TLine::SetBBoxX2(const Int_t x) |
| virtual void | TLine::SetBBoxY1(const Int_t y) |
| virtual void | TLine::SetBBoxY2(const Int_t y) |
| void | TObject::SetBit(UInt_t f) |
| void | TObject::SetBit(UInt_t f, Bool_t set) |
| virtual void | SetDecimals(Bool_t dot = kTRUE)MENU |
| virtual void | TObject::SetDrawOption(Option_t* option = "")MENU |
| static void | TObject::SetDtorOnly(void* obj) |
| static void | SetExponentOffset(Float_t xoff = 0., Float_t yoff = 0., Option_t* axis = "xy") |
| void | SetFunction(const char* funcname = "") |
| void | SetGridLength(Float_t gridlength) |
| void | TLine::SetHorizontal(Bool_t set = kTRUE)TOGGLE GETTER |
| void | SetLabelColor(Int_t labelcolor)MENU |
| void | SetLabelFont(Int_t labelfont)MENU |
| void | SetLabelOffset(Float_t labeloffset)MENU |
| void | SetLabelSize(Float_t labelsize)MENU |
| virtual void | TAttLine::SetLineAttributes()MENU |
| virtual void | TAttLine::SetLineColor(Color_t lcolor) |
| virtual void | TAttLine::SetLineColorAlpha(Color_t lcolor, Float_t lalpha) |
| virtual void | TAttLine::SetLineStyle(Style_t lstyle) |
| virtual void | TAttLine::SetLineWidth(Width_t lwidth) |
| static void | SetMaxDigits(Int_t maxd = 5) |
| virtual void | SetMoreLogLabels(Bool_t more = kTRUE)MENU |
| virtual void | SetName(const char* name)MENU |
| virtual void | TLine::SetNDC(Bool_t isNDC = kTRUE) |
| virtual void | SetNdivisions(Int_t ndiv)MENU |
| virtual void | SetNoExponent(Bool_t noExponent = kTRUE)MENU |
| static void | TObject::SetObjectStat(Bool_t stat) |
| void | SetOption(Option_t* option = "") |
| virtual void | TAttText::SetTextAlign(Short_t align = 11) |
| virtual void | TAttText::SetTextAngle(Float_t tangle = 0)MENU |
| virtual void | TAttText::SetTextAttributes()MENU |
| virtual void | TAttText::SetTextColor(Color_t tcolor = 1) |
| virtual void | TAttText::SetTextColorAlpha(Color_t tcolor, Float_t talpha) |
| virtual void | TAttText::SetTextFont(Font_t tfont = 62) |
| virtual void | TAttText::SetTextSize(Float_t tsize = 1) |
| virtual void | TAttText::SetTextSizePixels(Int_t npixels) |
| void | SetTickLength(Float_t ticklength) |
| void | SetTickSize(Float_t ticksize)MENU |
| void | SetTimeFormat(const char* tformat) |
| void | SetTimeOffset(Double_t toffset, Option_t* option = "local") |
| virtual void | SetTitle(const char* title = "")MENU |
| void | SetTitleColor(Int_t titlecolor)MENU |
| void | SetTitleFont(Int_t titlefont)MENU |
| void | SetTitleOffset(Float_t titleoffset = 1)MENU |
| void | SetTitleSize(Float_t titlesize)MENU |
| virtual void | TObject::SetUniqueID(UInt_t uid) |
| void | TLine::SetVertical(Bool_t set = kTRUE)TOGGLE GETTER |
| void | SetWmax(Double_t wmax) |
| void | SetWmin(Double_t wmin) |
| virtual void | TLine::SetX1(Double_t x1) |
| virtual void | TLine::SetX2(Double_t x2) |
| virtual void | TLine::SetY1(Double_t y1) |
| virtual void | TLine::SetY2(Double_t y2) |
| virtual void | ShowMembers(TMemberInspector& insp) const |
| virtual void | Streamer(TBuffer&) |
| void | StreamerNVirtual(TBuffer& ClassDef_StreamerNVirtual_b) |
| virtual void | TObject::SysError(const char* method, const char* msgfmt) const |
| Bool_t | TObject::TestBit(UInt_t f) const |
| Int_t | TObject::TestBits(UInt_t f) const |
| TGaxis() | |
| TGaxis(Double_t xmin, Double_t ymin, Double_t xmax, Double_t ymax, const char* funcname, Int_t ndiv = 510, Option_t* chopt = "", Double_t gridlength = 0) | |
| TGaxis(Double_t xmin, Double_t ymin, Double_t xmax, Double_t ymax, Double_t wmin, Double_t wmax, Int_t ndiv = 510, Option_t* chopt = "", Double_t gridlength = 0) | |
| virtual void | TObject::UseCurrentStyle() |
| virtual void | TObject::Warning(const char* method, const char* msgfmt) const |
| virtual Int_t | TObject::Write(const char* name = 0, Int_t option = 0, Int_t bufsize = 0) |
| virtual Int_t | TObject::Write(const char* name = 0, Int_t option = 0, Int_t bufsize = 0) const |
| virtual void | TObject::DoError(int level, const char* location, const char* fmt, va_list va) const |
| void | TObject::MakeZombie() |
| TGaxis& | operator=(const TGaxis&) |
| TGaxis(const TGaxis&) |
Data Members
| static TObject::(anonymous) | TObject::kBitMask | |
| static TObject::EStatusBits | TObject::kCanDelete | |
| static TObject::EStatusBits | TObject::kCannotPick | |
| static TObject::EStatusBits | TObject::kHasUUID | |
| static TLine::(anonymous) | TLine::kHorizontal | |
| static TObject::EStatusBits | TObject::kInvalidObject | |
| static TObject::(anonymous) | TObject::kIsOnHeap | |
| static TObject::EStatusBits | TObject::kIsReferenced | |
| static TLine::(anonymous) | TLine::kLineNDC | |
| static TObject::EStatusBits | TObject::kMustCleanup | |
| static TObject::EStatusBits | TObject::kNoContextMenu | |
| static TObject::(anonymous) | TObject::kNotDeleted | |
| static TObject::EStatusBits | TObject::kObjInCanvas | |
| static TObject::(anonymous) | TObject::kOverwrite | |
| static TObject::(anonymous) | TObject::kSingleKey | |
| static TLine::(anonymous) | TLine::kVertical | |
| static TObject::(anonymous) | TObject::kWriteDelete | |
| static TObject::(anonymous) | TObject::kZombie |
| TAxis* | fAxis | !pointer to original TAxis axis (if any) |
| TString | fChopt | Axis options |
| TF1* | fFunction | !Pointer to function computing axis values |
| TString | fFunctionName | name of mapping function pointed by fFunction |
| Float_t | fGridLength | Length of the grid in NDC |
| Int_t | fLabelColor | Color for labels |
| Int_t | fLabelFont | Font for labels |
| Float_t | fLabelOffset | Offset of label wrt axis |
| Float_t | fLabelSize | Size of labels in NDC |
| Color_t | TAttLine::fLineColor | line color |
| Style_t | TAttLine::fLineStyle | line style |
| Width_t | TAttLine::fLineWidth | line width |
| TString | fName | axis name |
| Int_t | fNdiv | Number of divisions |
| Short_t | TAttText::fTextAlign | Text alignment |
| Float_t | TAttText::fTextAngle | Text angle |
| Color_t | TAttText::fTextColor | Text color index |
| Font_t | TAttText::fTextFont | Text font number |
| Float_t | TAttText::fTextSize | Text size |
| Float_t | fTickSize | Size of primary tick mark in NDC |
| TString | fTimeFormat | Time format, ex: 09/12/99 12:34:00 |
| TString | fTitle | axis title |
| Float_t | fTitleOffset | Offset of title wrt axis |
| Float_t | fTitleSize | Size of title in NDC |
| Double_t | fWmax | Highest value on the axis |
| Double_t | fWmin | Lowest value on the axis |
| Double_t | TLine::fX1 | X of 1st point |
| Double_t | TLine::fX2 | X of 2nd point |
| static Float_t | fXAxisExpXOffset | !Exponent X offset for the X axis |
| static Float_t | fXAxisExpYOffset | !Exponent Y offset for the X axis |
| Double_t | TLine::fY1 | Y of 1st point |
| Double_t | TLine::fY2 | Y of 2nd point |
| static Float_t | fYAxisExpXOffset | !Exponent X offset for the Y axis |
| static Float_t | fYAxisExpYOffset | !Exponent Y offset for the Y axis |
| static Int_t | fgMaxDigits | !Number of digits above which the 10>N notation is used |
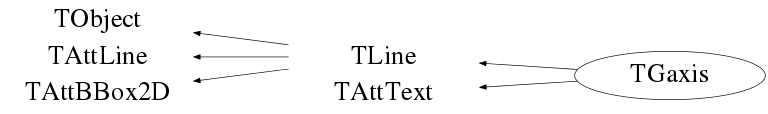
Class Charts
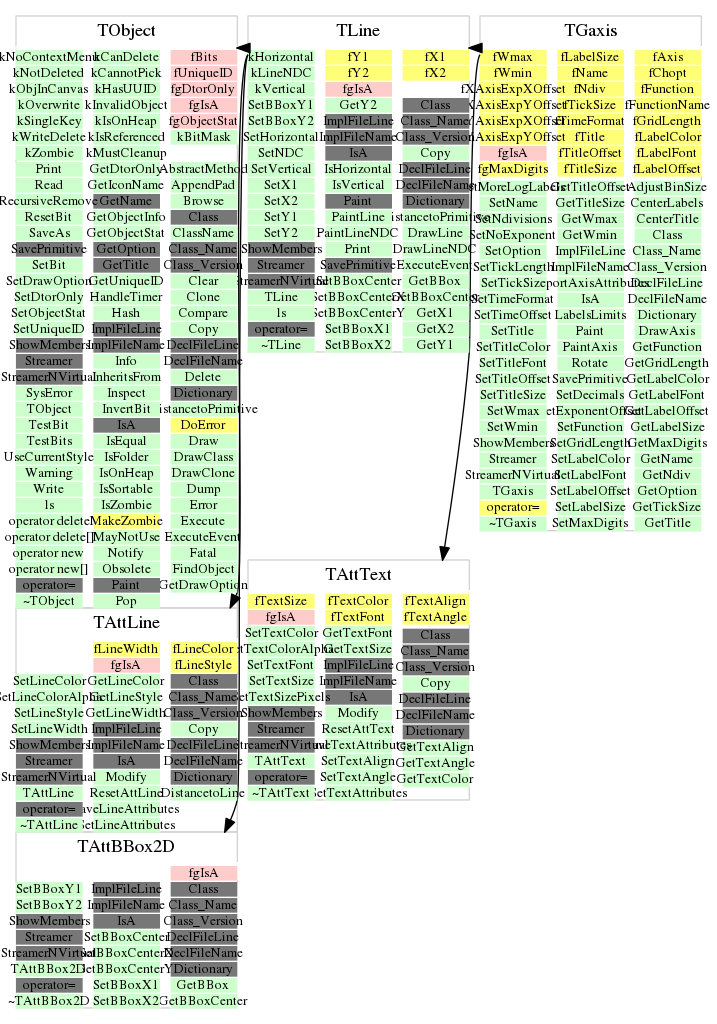
Function documentation
TGaxis normal constructor.
Constructor with a TF1 to map axis values.
If center = kTRUE axis labels are centered in the center of the bin. The default is to center on the primary tick marks. This option does not make sense if there are more bins than tick marks.
If center = kTRUE axis title will be centered. The default is right adjusted.
Draw this axis with new attributes.
Control function to draw an axis.
Original authors: O.Couet C.E.Vandoni N.Cremel-Somon. Modified and converted to C++ class by Rene Brun.
Internal method for axis labels optimisation. This method adjusts the bining of the axis in order to have integer values for the labels.
Input parameters:
- A1,A2 : Old WMIN,WMAX
- binLow,binHigh : New WMIN,WMAX
- nold : Old NDIV (primary divisions)
- nbins : New NDIV
Internal method to find first and last character of a label.
Internal method to rotate axis coordinates.
Save primitive as a C++ statement(s) on output stream out
Set the decimals flag. By default, blank characters are stripped, and then the label is correctly aligned. The dot, if last character of the string, is also stripped, unless this option is specified. One can disable the option by calling axis.SetDecimals(kTRUE). Note the bit is set in fBits (as opposed to fBits2 in TAxis!)
Static function to set fgMaxDigits for axis.fgMaxDigits is the maximum number of digits permitted for the axis labels above which the notation with 10^N is used.For example, to accept 6 digits number like 900000 on an axis call TGaxis::SetMaxDigits(6). The default value is 5. fgMaxDigits must be greater than 0.
Set the kMoreLogLabels bit flag. When this option is selected more labels are drawn when in logarithmic scale and there is a small number of decades (less than 3). Note that this option is automatically inherited from TAxis
Set the NoExponent flag. By default, an exponent of the form 10^N is used when the label values are either all very small or very large. One can disable the exponent by calling axis.SetNoExponent(kTRUE).
Change the format used for time plotting. The format string for date and time use the same options as the one used in the standard strftime C function, i.e. :
for date :
- %a abbreviated weekday name
- %b abbreviated month name
- %d day of the month (01-31)
- %m month (01-12)
- %y year without century
- %H hour (24-hour clock)
- %I hour (12-hour clock)
- %p local equivalent of AM or PM
- %M minute (00-59)
- %S seconds (00-61)
- %% %
Change the time offset. If option = "gmt", set display mode to GMT.
Static function to set X and Y offset of the axis 10^n notation. It is in % of the pad size. It can be negative. axis specifies which axis ("x","y"), default = "x" if axis="xz" set the two axes