class TMultiGraph: public TNamed
TMultiGraph class
TMultiGraph::Add should be used to add a new graph to the list.
The TMultiGraph owns the objects in the list.
The drawing options are the same as for TGraph. Like for TGraph, the painting is performed thanks to the TGraphPainter class. All details about the various painting options are given in this class. Example:
     TGraph *gr1 = new TGraph(...
     TGraphErrors *gr2 = new TGraphErrors(...
     TMultiGraph *mg = new TMultiGraph();
     mg->Add(gr1,"lp");
     mg->Add(gr2,"cp");
     mg->Draw("a");
A special option 3D allows to draw the graphs in a 3D space. See the
following example:
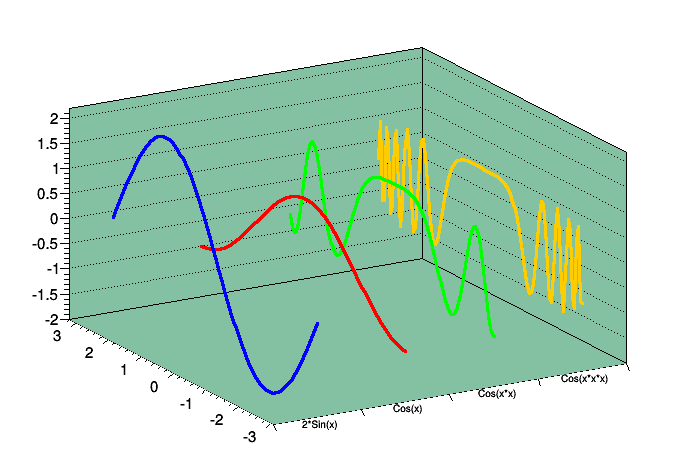
{
   c0 = new TCanvas("c1","multigraph L3",200,10,700,500);
   c0->SetFrameFillColor(30);

   TMultiGraph *mg = new TMultiGraph();

   TGraph *gr1 = new TGraph(); gr1->SetLineColor(kBlue);
   TGraph *gr2 = new TGraph(); gr2->SetLineColor(kRed);
   TGraph *gr3 = new TGraph(); gr3->SetLineColor(kGreen);
   TGraph *gr4 = new TGraph(); gr4->SetLineColor(kOrange);

   Double_t dx = 6.28/100;
   Double_t x  = -3.14;

   for (int i=0; i<=100; i++) {
      x = x+dx;
      gr1->SetPoint(i,x,2.*TMath::Sin(x));
      gr2->SetPoint(i,x,TMath::Cos(x));
      gr3->SetPoint(i,x,TMath::Cos(x*x));
      gr4->SetPoint(i,x,TMath::Cos(x*x*x));
   }

   mg->Add(gr4); gr4->SetTitle("Cos(x*x*x)"); gr4->SetLineWidth(3);
   mg->Add(gr3); gr3->SetTitle("Cos(x*x)")  ; gr3->SetLineWidth(3);
   mg->Add(gr2); gr2->SetTitle("Cos(x)")    ; gr2->SetLineWidth(3);
   mg->Add(gr1); gr1->SetTitle("2*Sin(x)")  ; gr1->SetLineWidth(3);

   mg->Draw("a fb l3d");
   return c0;
}
The number of graphs in a multigraph can be retrieve with:
mg->GetListOfGraphs()->GetSize();
The drawing option for each TGraph may be specified as an optional second argument of the Add function.
If a draw option is specified, it will be used to draw the graph, otherwise the graph will be drawn with the option specified in TMultiGraph::Draw.
The following example shows how to fit a TMultiGraph.
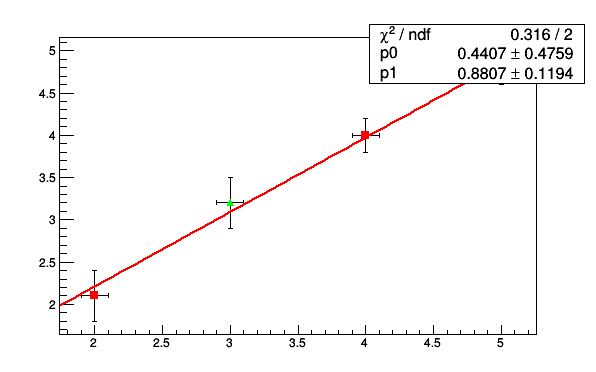
{
   TCanvas *c1 = new TCanvas("c1","c1",600,400);

   Double_t px1[2] = {2.,4.};
   Double_t dx1[2] = {0.1,0.1};
   Double_t py1[2] = {2.1,4.0};
   Double_t dy1[2] = {0.3,0.2};

   Double_t px2[2] = {3.,5.};
   Double_t dx2[2] = {0.1,0.1};
   Double_t py2[2] = {3.2,4.8};
   Double_t dy2[2] = {0.3,0.2};

   gStyle->SetOptFit(0001);

   TGraphErrors *g1 = new TGraphErrors(2,px1,py1,dx1,dy1);
   g1->SetMarkerStyle(21);
   g1->SetMarkerColor(2);

   TGraphErrors *g2 = new TGraphErrors(2,px2,py2,dx2,dy2);
   g2->SetMarkerStyle(22);
   g2->SetMarkerColor(3);

   TMultiGraph *g = new TMultiGraph();
   g->Add(g1);
   g->Add(g2);

   g->Draw("AP");

   g->Fit("pol1","FQ");
   return c1;
}
The axis titles can be modified the following way:
   [...]
   TMultiGraph *mg = new TMultiGraph;
   mg->SetTitle("title;xaxis title; yaxis title");
   mg->Add(g1);
   mg->Add(g2);
   mg->Draw("apl");
When the graphs in a TMultiGraph are fitted, the fit parameters boxes overlap. The following example shows how to make them all visible.
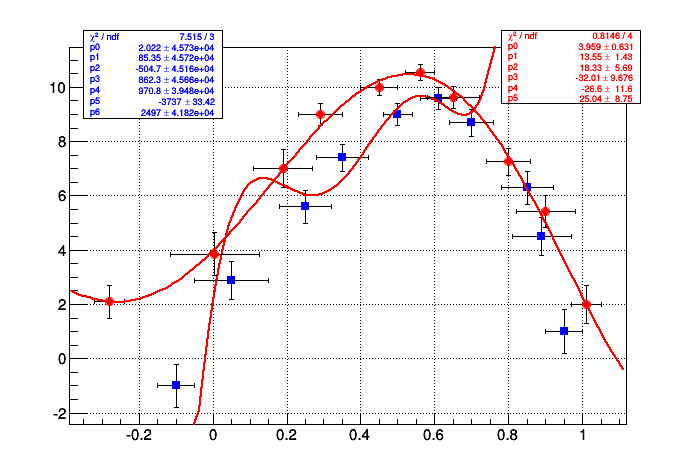
//Create and Draw a TMultiGraph
//Author:: Rene Brun
{
   gStyle->SetOptFit();
   TCanvas *c1 = new TCanvas("c1","multigraph",700,500);
   c1->SetGrid();

      // draw a frame to define the range
   TMultiGraph *mg = new TMultiGraph();

      // create first graph
   const Int_t n1 = 10;
   Double_t px1[] = {-0.1, 0.05, 0.25, 0.35, 0.5, 0.61,0.7,0.85,0.89,0.95};
   Double_t py1[] = {-1,2.9,5.6,7.4,9,9.6,8.7,6.3,4.5,1};
   Double_t ex1[] = {.05,.1,.07,.07,.04,.05,.06,.07,.08,.05};
   Double_t ey1[] = {.8,.7,.6,.5,.4,.4,.5,.6,.7,.8};
   TGraphErrors *gr1 = new TGraphErrors(n1,px1,py1,ex1,ey1);
   gr1->SetMarkerColor(kBlue);
   gr1->SetMarkerStyle(21);
   gr1->Fit("pol6","q");
   mg->Add(gr1);

      // create second graph
   const Int_t n2 = 10;
   Float_t x2[]  = {-0.28, 0.005, 0.19, 0.29, 0.45, 0.56,0.65,0.80,0.90,1.01};
   Float_t y2[]  = {2.1,3.86,7,9,10,10.55,9.64,7.26,5.42,2};
   Float_t ex2[] = {.04,.12,.08,.06,.05,.04,.07,.06,.08,.04};
   Float_t ey2[] = {.6,.8,.7,.4,.3,.3,.4,.5,.6,.7};
   TGraphErrors *gr2 = new TGraphErrors(n2,x2,y2,ex2,ey2);
   gr2->SetMarkerColor(kRed);
   gr2->SetMarkerStyle(20);
   gr2->Fit("pol5","q");

   mg->Add(gr2);

   mg->Draw("ap");

     //force drawing of canvas to generate the fit TPaveStats
   c1->Update();
   TPaveStats *stats1 = (TPaveStats*)gr1->GetListOfFunctions()->FindObject("stats");
   TPaveStats *stats2 = (TPaveStats*)gr2->GetListOfFunctions()->FindObject("stats");
   stats1->SetTextColor(kBlue);
   stats2->SetTextColor(kRed);
   stats1->SetX1NDC(0.12); stats1->SetX2NDC(0.32); stats1->SetY1NDC(0.75);
   stats2->SetX1NDC(0.72); stats2->SetX2NDC(0.92); stats2->SetY1NDC(0.78);
   c1->Modified();
   return c1;
}
The axis limits can be changed the like for TGraph. The same methods apply on the multigraph. Note the two differents ways to change limits on X and Y axis.
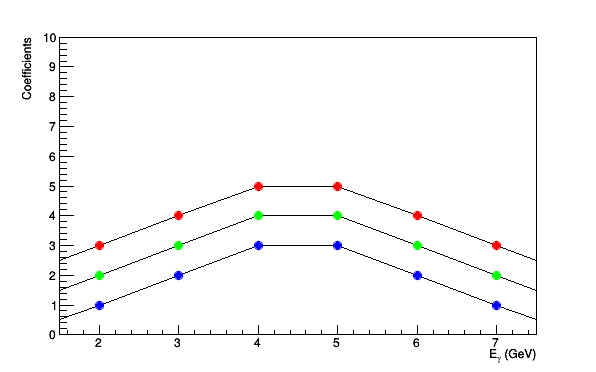
{
   TCanvas *c2 = new TCanvas("c2","c2",600,400);

   TGraph *g[3];
   Double_t x[10] = {0,1,2,3,4,5,6,7,8,9};
   Double_t y[10] = {1,2,3,4,5,5,4,3,2,1};
   TMultiGraph *mg = new TMultiGraph();
   for (int i=0; i<3; i++) {
      g[i] = new TGraph(10, x, y);
      g[i]->SetMarkerStyle(20);
      g[i]->SetMarkerColor(i+2);
      for (int j=0; j<10; j++) y[j] = y[j]-1;
      mg->Add(g[i]);
   }
   mg->Draw("APL");
   mg->GetXaxis()->SetTitle("E_{#gamma} (GeV)");
   mg->GetYaxis()->SetTitle("Coefficients");

   // Change the axis limits
   gPad->Modified();
   mg->GetXaxis()->SetLimits(1.5,7.5);
   mg->SetMinimum(0.);
   mg->SetMaximum(10.);

   return c2;
}
The method TPad::BuildLegend is able to extract the graphs inside a multigraph. The following example demonstrate this.
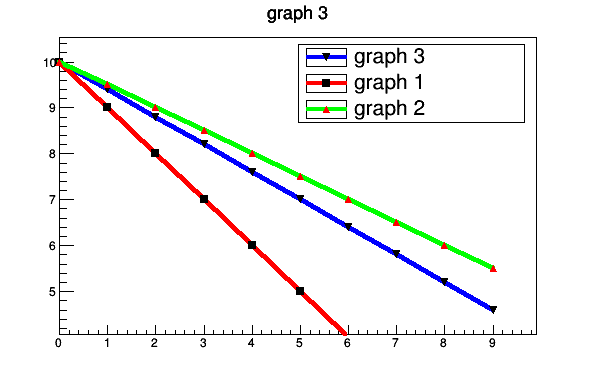
{
   TCanvas *c3 = new TCanvas("c3","c3",600, 400);

   TMultiGraph * mg = new TMultiGraph("mg","mg");

   const Int_t size = 10;

   double px[size];
   double py1[size];
   double py2[size];
   double py3[size];

   for ( int i = 0; i <  size ; ++i ) {
      px[i] = i;
      py1[i] = size - i;
      py2[i] = size - 0.5 * i;
      py3[i] = size - 0.6 * i;
   }

   TGraph * gr1 = new TGraph( size, px, py1 );
   gr1->SetName("gr1");
   gr1->SetTitle("graph 1");
   gr1->SetMarkerStyle(21);
   gr1->SetDrawOption("AP");
   gr1->SetLineColor(2);
   gr1->SetLineWidth(4);
   gr1->SetFillStyle(0);

   TGraph * gr2 = new TGraph( size, px, py2 );
   gr2->SetName("gr2");
   gr2->SetTitle("graph 2");
   gr2->SetMarkerStyle(22);
   gr2->SetMarkerColor(2);
   gr2->SetDrawOption("P");
   gr2->SetLineColor(3);
   gr2->SetLineWidth(4);
   gr2->SetFillStyle(0);

   TGraph * gr3 = new TGraph( size, px, py3 );
   gr3->SetName("gr3");
   gr3->SetTitle("graph 3");
   gr3->SetMarkerStyle(23);
   gr3->SetLineColor(4);
   gr3->SetLineWidth(4);
   gr3->SetFillStyle(0);

   mg->Add( gr1 );
   mg->Add( gr2 );

   gr3->Draw("ALP");
   mg->Draw("LP");
   c3->BuildLegend();

   return c3;
}
Function Members (Methods)
| virtual | ~TMultiGraph() |
| void | TObject::AbstractMethod(const char* method) const |
| virtual void | Add(TGraph* graph, Option_t* chopt = "") |
| virtual void | Add(TMultiGraph* multigraph, Option_t* chopt = "") |
| virtual void | TObject::AppendPad(Option_t* option = "") |
| virtual void | Browse(TBrowser* b) |
| static TClass* | Class() |
| virtual const char* | TObject::ClassName() const |
| virtual void | TNamed::Clear(Option_t* option = "") |
| virtual TObject* | TNamed::Clone(const char* newname = "") const |
| virtual Int_t | TNamed::Compare(const TObject* obj) const |
| virtual void | TNamed::Copy(TObject& named) const |
| virtual void | TObject::Delete(Option_t* option = "")MENU |
| virtual Int_t | DistancetoPrimitive(Int_t px, Int_t py) |
| virtual void | Draw(Option_t* chopt = "") |
| virtual void | TObject::DrawClass() constMENU |
| virtual TObject* | TObject::DrawClone(Option_t* option = "") constMENU |
| virtual void | TObject::Dump() constMENU |
| virtual void | TObject::Error(const char* method, const char* msgfmt) const |
| virtual void | TObject::Execute(const char* method, const char* params, Int_t* error = 0) |
| virtual void | TObject::Execute(TMethod* method, TObjArray* params, Int_t* error = 0) |
| virtual void | TObject::ExecuteEvent(Int_t event, Int_t px, Int_t py) |
| virtual void | TObject::Fatal(const char* method, const char* msgfmt) const |
| virtual void | TNamed::FillBuffer(char*& buffer) |
| virtual TObject* | TObject::FindObject(const char* name) const |
| virtual TObject* | TObject::FindObject(const TObject* obj) const |
| virtual TFitResultPtr | Fit(const char* formula, Option_t* option = "", Option_t* goption = "", Axis_t xmin = 0, Axis_t xmax = 0) |
| virtual TFitResultPtr | Fit(TF1* f1, Option_t* option = "", Option_t* goption = "", Axis_t rxmin = 0, Axis_t rxmax = 0) |
| virtual void | FitPanel()MENU |
| virtual Option_t* | TObject::GetDrawOption() const |
| static Long_t | TObject::GetDtorOnly() |
| TF1* | GetFunction(const char* name) const |
| virtual Option_t* | GetGraphDrawOption(const TGraph* gr) const |
| TH1F* | GetHistogram() const |
| virtual const char* | TObject::GetIconName() const |
| TList* | GetListOfFunctions() |
| const TList* | GetListOfFunctions() const |
| TList* | GetListOfGraphs() const |
| virtual const char* | TNamed::GetName() const |
| virtual char* | TObject::GetObjectInfo(Int_t px, Int_t py) const |
| static Bool_t | TObject::GetObjectStat() |
| virtual Option_t* | TObject::GetOption() const |
| virtual const char* | TNamed::GetTitle() const |
| virtual UInt_t | TObject::GetUniqueID() const |
| TAxis* | GetXaxis() const |
| TAxis* | GetYaxis() const |
| virtual Bool_t | TObject::HandleTimer(TTimer* timer) |
| virtual ULong_t | TNamed::Hash() const |
| virtual void | TObject::Info(const char* method, const char* msgfmt) const |
| virtual Bool_t | TObject::InheritsFrom(const char* classname) const |
| virtual Bool_t | TObject::InheritsFrom(const TClass* cl) const |
| virtual void | InitExpo(Double_t xmin, Double_t xmax) |
| virtual void | InitGaus(Double_t xmin, Double_t xmax) |
| virtual void | InitPolynom(Double_t xmin, Double_t xmax) |
| virtual void | TObject::Inspect() constMENU |
| void | TObject::InvertBit(UInt_t f) |
| virtual TClass* | IsA() const |
| virtual Bool_t | TObject::IsEqual(const TObject* obj) const |
| virtual Bool_t | TObject::IsFolder() const |
| virtual Int_t | IsInside(Double_t x, Double_t y) const |
| Bool_t | TObject::IsOnHeap() const |
| virtual Bool_t | TNamed::IsSortable() const |
| Bool_t | TObject::IsZombie() const |
| virtual void | LeastSquareFit(Int_t m, Double_t* a, Double_t xmin, Double_t xmax) |
| virtual void | LeastSquareLinearFit(Int_t ndata, Double_t& a0, Double_t& a1, Int_t& ifail, Double_t xmin, Double_t xmax) |
| virtual void | TNamed::ls(Option_t* option = "") const |
| void | TObject::MayNotUse(const char* method) const |
| virtual Bool_t | TObject::Notify() |
| void | TObject::Obsolete(const char* method, const char* asOfVers, const char* removedFromVers) const |
| void | TObject::operator delete(void* ptr) |
| void | TObject::operator delete(void* ptr, void* vp) |
| void | TObject::operator delete[](void* ptr) |
| void | TObject::operator delete[](void* ptr, void* vp) |
| void* | TObject::operator new(size_t sz) |
| void* | TObject::operator new(size_t sz, void* vp) |
| void* | TObject::operator new[](size_t sz) |
| void* | TObject::operator new[](size_t sz, void* vp) |
| virtual void | Paint(Option_t* chopt = "") |
| void | PaintPads(Option_t* chopt = "") |
| void | PaintPolyLine3D(Option_t* chopt = "") |
| virtual void | TObject::Pop() |
| virtual void | Print(Option_t* chopt = "") const |
| virtual Int_t | TObject::Read(const char* name) |
| virtual void | RecursiveRemove(TObject* obj) |
| void | TObject::ResetBit(UInt_t f) |
| virtual void | TObject::SaveAs(const char* filename = "", Option_t* option = "") constMENU |
| virtual void | SavePrimitive(ostream& out, Option_t* option = "") |
| void | TObject::SetBit(UInt_t f) |
| void | TObject::SetBit(UInt_t f, Bool_t set) |
| virtual void | TObject::SetDrawOption(Option_t* option = "")MENU |
| static void | TObject::SetDtorOnly(void* obj) |
| virtual void | SetMaximum(Double_t maximum = -1111) |
| virtual void | SetMinimum(Double_t minimum = -1111) |
| virtual void | TNamed::SetName(const char* name)MENU |
| virtual void | TNamed::SetNameTitle(const char* name, const char* title) |
| static void | TObject::SetObjectStat(Bool_t stat) |
| virtual void | TNamed::SetTitle(const char* title = "")MENU |
| virtual void | TObject::SetUniqueID(UInt_t uid) |
| virtual void | ShowMembers(TMemberInspector& insp) const |
| virtual Int_t | TNamed::Sizeof() const |
| virtual void | Streamer(TBuffer&) |
| void | StreamerNVirtual(TBuffer& ClassDef_StreamerNVirtual_b) |
| virtual void | TObject::SysError(const char* method, const char* msgfmt) const |
| Bool_t | TObject::TestBit(UInt_t f) const |
| Int_t | TObject::TestBits(UInt_t f) const |
| TMultiGraph() | |
| TMultiGraph(const char* name, const char* title) | |
| virtual void | TObject::UseCurrentStyle() |
| virtual void | TObject::Warning(const char* method, const char* msgfmt) const |
| virtual Int_t | TObject::Write(const char* name = 0, Int_t option = 0, Int_t bufsize = 0) |
| virtual Int_t | TObject::Write(const char* name = 0, Int_t option = 0, Int_t bufsize = 0) const |
| virtual void | TObject::DoError(int level, const char* location, const char* fmt, va_list va) const |
| void | TObject::MakeZombie() |
| TMultiGraph& | operator=(const TMultiGraph&) |
| TMultiGraph(const TMultiGraph&) |
Data Members
| static TObject::<anonymous> | TObject::kBitMask | |
| static TObject::EStatusBits | TObject::kCanDelete | |
| static TObject::EStatusBits | TObject::kCannotPick | |
| static TObject::EStatusBits | TObject::kHasUUID | |
| static TObject::EStatusBits | TObject::kInvalidObject | |
| static TObject::<anonymous> | TObject::kIsOnHeap | |
| static TObject::EStatusBits | TObject::kIsReferenced | |
| static TObject::EStatusBits | TObject::kMustCleanup | |
| static TObject::EStatusBits | TObject::kNoContextMenu | |
| static TObject::<anonymous> | TObject::kNotDeleted | |
| static TObject::EStatusBits | TObject::kObjInCanvas | |
| static TObject::<anonymous> | TObject::kOverwrite | |
| static TObject::<anonymous> | TObject::kSingleKey | |
| static TObject::<anonymous> | TObject::kWriteDelete | |
| static TObject::<anonymous> | TObject::kZombie |
| TList* | fFunctions | Pointer to list of functions (fits and user) |
| TList* | fGraphs | Pointer to list of TGraphs |
| TH1F* | fHistogram | Pointer to histogram used for drawing axis |
| Double_t | fMaximum | Maximum value for plotting along y |
| Double_t | fMinimum | Minimum value for plotting along y |
| TString | TNamed::fName | object identifier |
| TString | TNamed::fTitle | object title |
Class Charts

Function documentation
 Add a new graph to the list of graphs.
 Note that the graph is now owned by the TMultigraph.
 Deleting the TMultiGraph object will automatically delete the graphs.
 You should not delete the graphs when the TMultigraph is still active.
 Add all the graphs in "multigraph" to the list of graphs.
 If "chopt" is defined all the graphs in "multigraph" will be added with
 the "chopt" option.
 If "chopt" is undefined each graph will be added with the option it had
 in "multigraph".
 Draw this multigraph with its current attributes.

   Options to draw a graph are described in TGraphPainter.

  The drawing option for each TGraph may be specified as an optional
  second argument of the Add function. You can use GetGraphDrawOption
  to return this option.
  If a draw option is specified, it will be used to draw the graph,
  otherwise the graph will be drawn with the option specified in
  TMultiGraph::Draw. Use GetDrawOption to return the option specified
  when drawing the TMultiGraph.
 Fit this multigraph with function f1.

   In this function all graphs of the multigraph are fitted simultaneously

   f1 is an already predefined function created by TF1.
   Predefined functions such as gaus, expo and poln are automatically
   created by ROOT.

   The list of fit options is given in parameter option.
      option = "W"  Set all errors to 1
             = "U" Use a User specified fitting algorithm (via SetFCN)
             = "Q" Quiet mode (minimum printing)
             = "V" Verbose mode (default is between Q and V)
             = "B" Use this option when you want to fix one or more parameters
                   and the fitting function is like "gaus","expo","poln","landau".
             = "R" Use the Range specified in the function range
             = "N" Do not store the graphics function, do not draw
             = "0" Do not plot the result of the fit. By default the fitted function
                   is drawn unless the option"N" above is specified.
             = "+" Add this new fitted function to the list of fitted functions
                   (by default, any previous function is deleted)
             = "C" In case of linear fitting, not calculate the chisquare
                    (saves time)
             = "F" If fitting a polN, switch to minuit fitter
             = "ROB" In case of linear fitting, compute the LTS regression
                     coefficients (robust(resistant) regression), using
                     the default fraction of good points
               "ROB=0.x" - compute the LTS regression coefficients, using
                           0.x as a fraction of good points

   When the fit is drawn (by default), the parameter goption may be used
   to specify a list of graphics options. See TGraph::Paint for a complete
   list of these options.

   In order to use the Range option, one must first create a function
   with the expression to be fitted. For example, if your graph
   has a defined range between -4 and 4 and you want to fit a gaussian
   only in the interval 1 to 3, you can do:
        TF1 *f1 = new TF1("f1","gaus",1,3);
        graph->Fit("f1","R");


   who is calling this function

   Note that this function is called when calling TGraphErrors::Fit
   or TGraphAsymmErrors::Fit ot TGraphBentErrors::Fit
   see the discussion below on the errors calulation.

   Setting initial conditions

   Parameters must be initialized before invoking the Fit function.
   The setting of the parameter initial values is automatic for the
   predefined functions : poln, expo, gaus, landau. One can however disable
   this automatic computation by specifying the option "B".
   You can specify boundary limits for some or all parameters via
        f1->SetParLimits(p_number, parmin, parmax);
   if parmin>=parmax, the parameter is fixed
   Note that you are not forced to fix the limits for all parameters.
   For example, if you fit a function with 6 parameters, you can do:
     func->SetParameters(0,3.1,1.e-6,0.1,-8,100);
     func->SetParLimits(4,-10,-4);
     func->SetParLimits(5, 1,1);
   With this setup, parameters 0->3 can vary freely
   Parameter 4 has boundaries [-10,-4] with initial value -8
   Parameter 5 is fixed to 100.

  Fit range

  The fit range can be specified in two ways:
    - specify rxmax > rxmin (default is rxmin=rxmax=0)
    - specify the option "R". In this case, the function will be taken
      instead of the full graph range.

  Changing the fitting function

   By default a chi2 fitting function is used for fitting the TGraphs's.
   The function is implemented in FitUtil::EvaluateChi2.
   In case of TGraphErrors an effective chi2 is used
   (see TGraphErrors fit in TGraph::Fit) and is implemented in
   FitUtil::EvaluateChi2Effective
   To specify a User defined fitting function, specify option "U" and
   call the following functions:
     TVirtualFitter::Fitter(mygraph)->SetFCN(MyFittingFunction)
   where MyFittingFunction is of type:
   extern void MyFittingFunction(Int_t &npar, Double_t *gin, Double_t &f, Double_t *u, Int_t flag);

  Access to the fit result

  The function returns a TFitResultPtr which can hold a  pointer to a TFitResult object.
  By default the TFitResultPtr contains only the status of the fit and it converts
  automatically to an integer. If the option "S" is instead used, TFitResultPtr contains
  the TFitResult and behaves as a smart pointer to it. For example one can do:
     TFitResultPtr r = graph->Fit("myFunc","S");
     TMatrixDSym cov = r->GetCovarianceMatrix();  //  to access the covariance matrix
     Double_t par0   = r->Parameter(0); // retrieve the value for the parameter 0
     Double_t err0   = r->ParError(0); // retrieve the error for the parameter 0
     r->Print("V");     // print full information of fit including covariance matrix
     r->Write();        // store the result in a file

   The fit parameters, error and chi2 (but not covariance matrix) can be retrieved also
   from the fitted function.


   Associated functions

  One or more object (typically a TF1*) can be added to the list
  of functions (fFunctions) associated to each graph.
  When TGraph::Fit is invoked, the fitted function is added to this list.
  Given a graph gr, one can retrieve an associated function
  with:  TF1 *myfunc = gr->GetFunction("myfunc");

  If the graph is made persistent, the list of
  associated functions is also persistent. Given a pointer (see above)
  to an associated function myfunc, one can retrieve the function/fit
  parameters with calls such as:
    Double_t chi2 = myfunc->GetChisquare();
    Double_t par0 = myfunc->GetParameter(0); //value of 1st parameter
    Double_t err0 = myfunc->GetParError(0);  //error on first parameter

   Fit Statistics

  You can change the statistics box to display the fit parameters with
  the TStyle::SetOptFit(mode) method. This mode has four digits.
  mode = pcev  (default = 0111)
    v = 1;  print name/values of parameters
    e = 1;  print errors (if e=1, v must be 1)
    c = 1;  print Chisquare/Number of degress of freedom
    p = 1;  print Probability

  For example: gStyle->SetOptFit(1011);
  prints the fit probability, parameter names/values, and errors.
  You can change the position of the statistics box with these lines
  (where g is a pointer to the TGraph):

  Root > TPaveStats *st = (TPaveStats*)g->GetListOfFunctions()->FindObject("stats")
  Root > st->SetX1NDC(newx1); //new x start position
  Root > st->SetX2NDC(newx2); //new x end position
 Return the draw option for the TGraph gr in this TMultiGraph.
 The return option is the one specified when calling TMultiGraph::Add(gr,option).
Compute Initial values of parameters for an exponential.
 Least squares lpolynomial fitting without weights.

  m     number of parameters
  a     array of parameters
  first 1st point number to fit (default =0)
  last  last point number to fit (default=fNpoints-1)

   based on CERNLIB routine LSQ: Translated to C++ by Rene Brun
 Least square linear fit without weights.

  Fit a straight line (a0 + a1*x) to the data in this graph.
  ndata:  number of points to fit
  first:  first point number to fit
  last:   last point to fit O(ndata should be last-first
  ifail:  return parameter indicating the status of the fit (ifail=0, fit is OK)

   extracted from CERNLIB LLSQ: Translated to C++ by Rene Brun
Return 1 if the point (x,y) is inside one of the graphs 0 otherwise.
 Returns a pointer to the histogram used to draw the axis.
 Takes into account the two following cases.
    1- option 'A' was specified in TMultiGraph::Draw. Return fHistogram
    2- user had called TPad::DrawFrame. return pointer to hframe histogram
 Return pointer to list of functions.
 If pointer is null create the list
 Get x axis of the graph.
 This method returns a valid axis only after the TMultigraph has been drawn.
 Get y axis of the graph.
 This method returns a valid axis only after the TMultigraph has been drawn.
Divides the active pad and draws all Graphs in the Multigraph separately.
 Recursively remove this object from a list. Typically implemented
 by classes that can contain multiple references to a same object.
Save primitive as a C++ statement(s) on output stream out.