

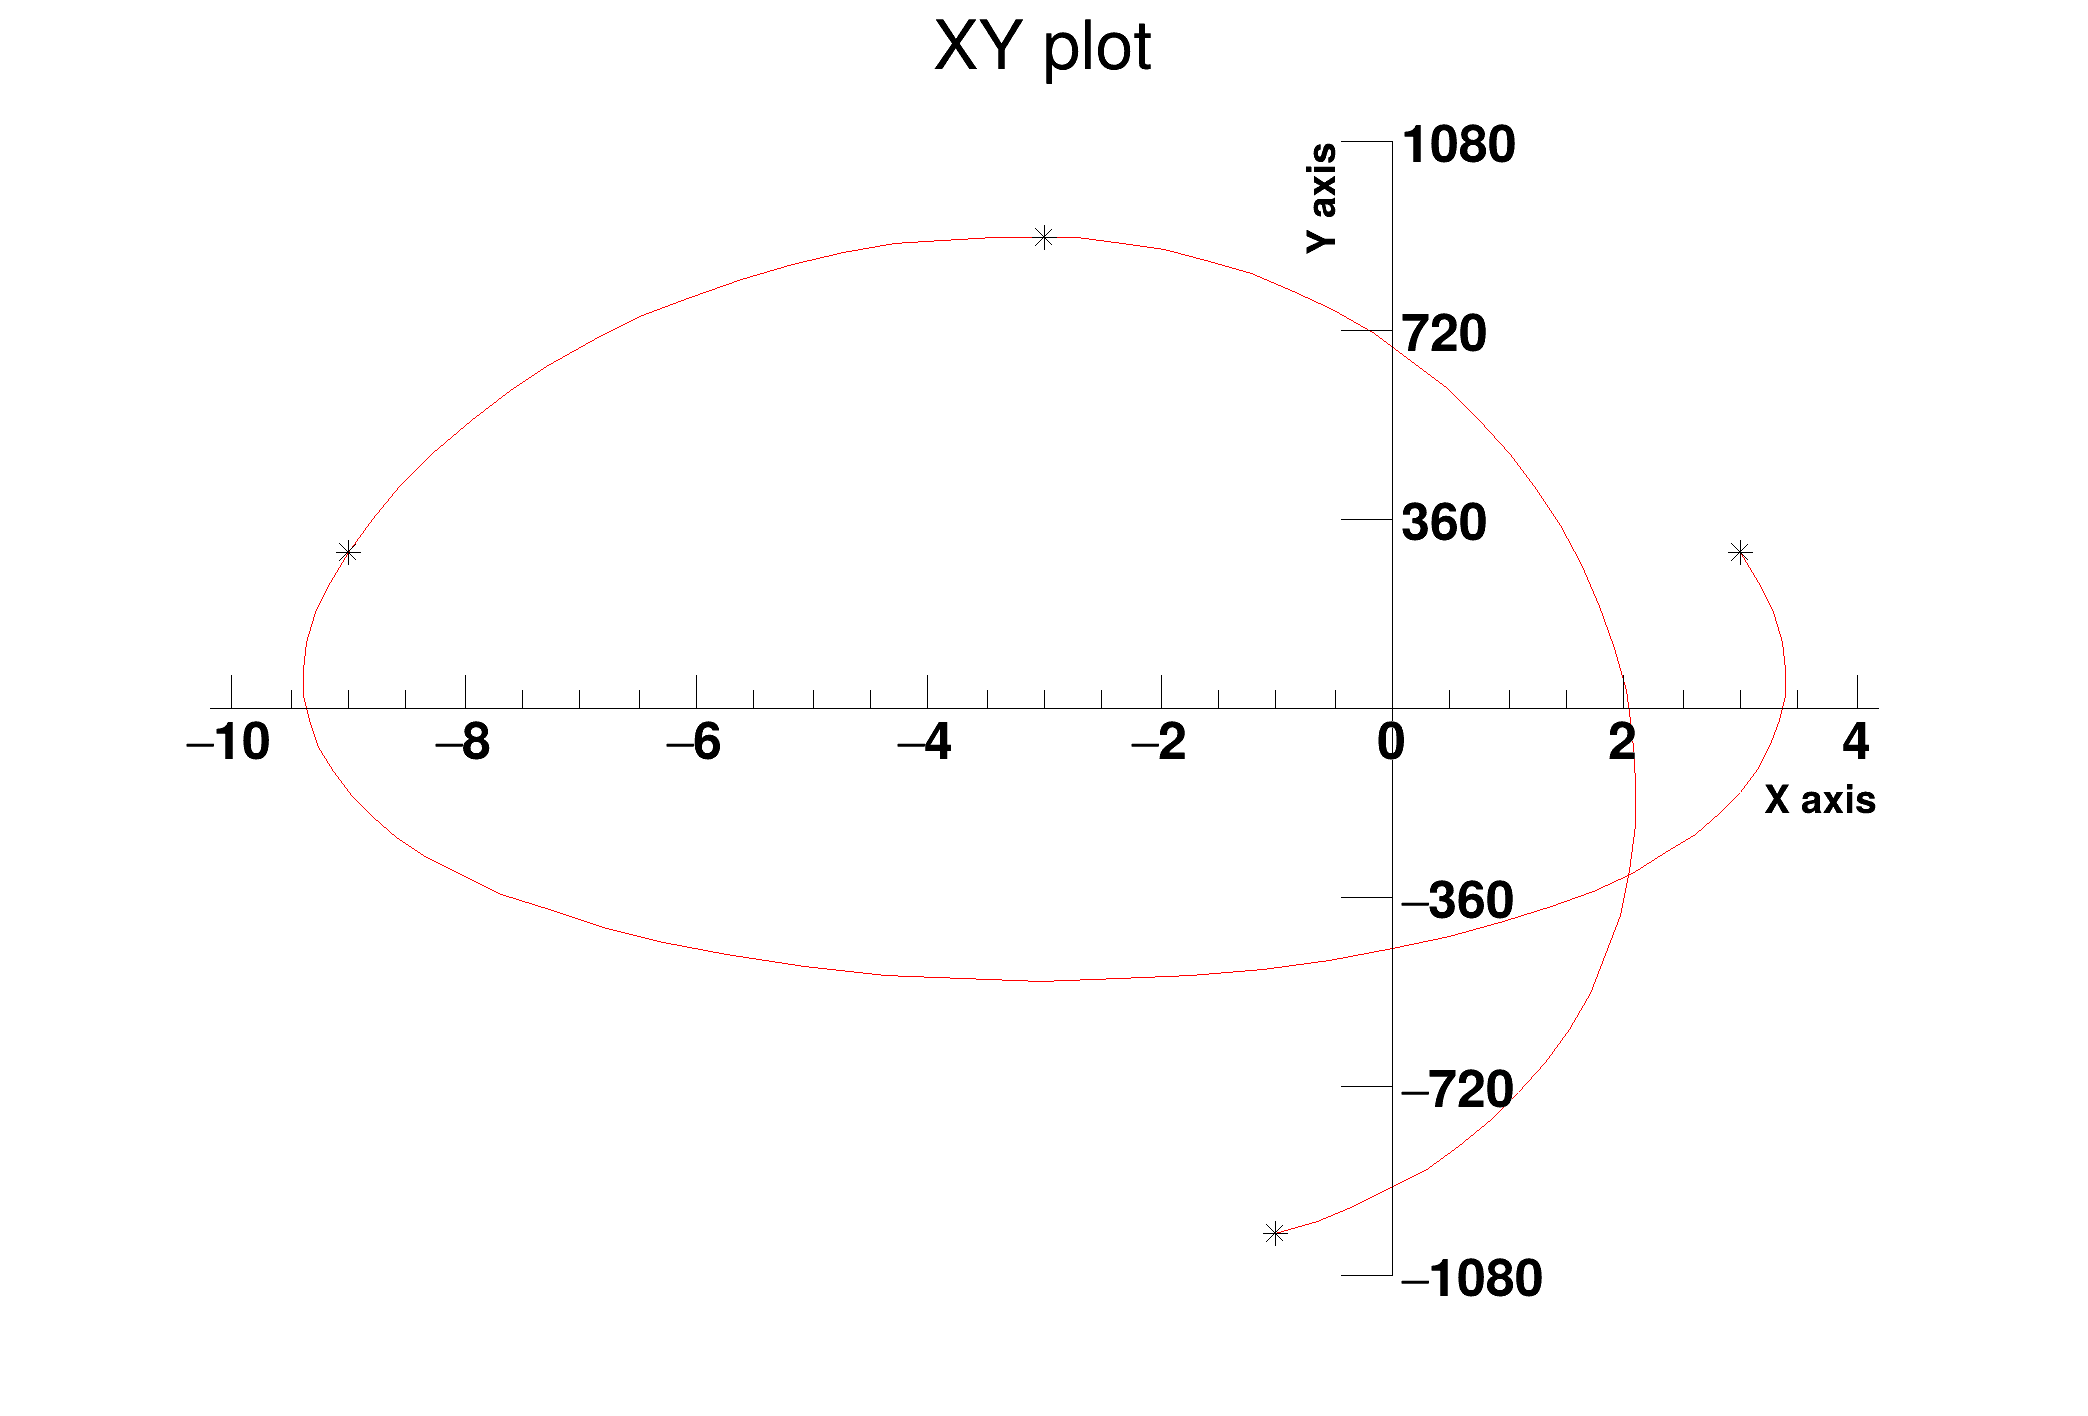
 Example showing how to produce a plot with an orthogonal axis system centered at (0,0).
{
c->SetFrameBorderMode(0);
yaxis->ChangeLabel(4, -1, 0.);
}
ROOT::Detail::TRangeCast< T, true > TRangeDynCast
TRangeDynCast is an adapter class that allows the typed iteration through a TCollection.
virtual void SetLineColor(Color_t lcolor)
Set the line color.
A TGraph is an object made of two arrays X and Y with npoints each.
virtual void SetMaximum(Double_t maximum=-1111)
Set the maximum of the graph.
void Draw(Option_t *chopt="") override
Draw this graph with its current attributes.
virtual TH1F * GetHistogram() const
Returns a pointer to the histogram used to draw the axis Takes into account the two following cases.
void SetTitle(const char *title="") override
Change (i.e.
virtual void SetMinimum(Double_t minimum=-1111)
Set the minimum of the graph.
To draw Mathematical Formula.
- Date
- January 2017
- Author
- Olivier Couet
Definition in file xyplot.C.