import ROOT
mixState =
ROOT.RooCategory(
"mixState",
"B0/B0bar mixing state", {
"mixed": -1,
"unmixed": 1})
tagFlav =
ROOT.RooCategory(
"tagFlav",
"Flavour of the tagged B0", {
"B0": 1,
"B0bar": -1})
bmix =
ROOT.RooBMixDecay(
"bmix",
"decay", dt, mixState, tagFlav, tau, dm, w, dw, tm, type=
"DoubleSided")
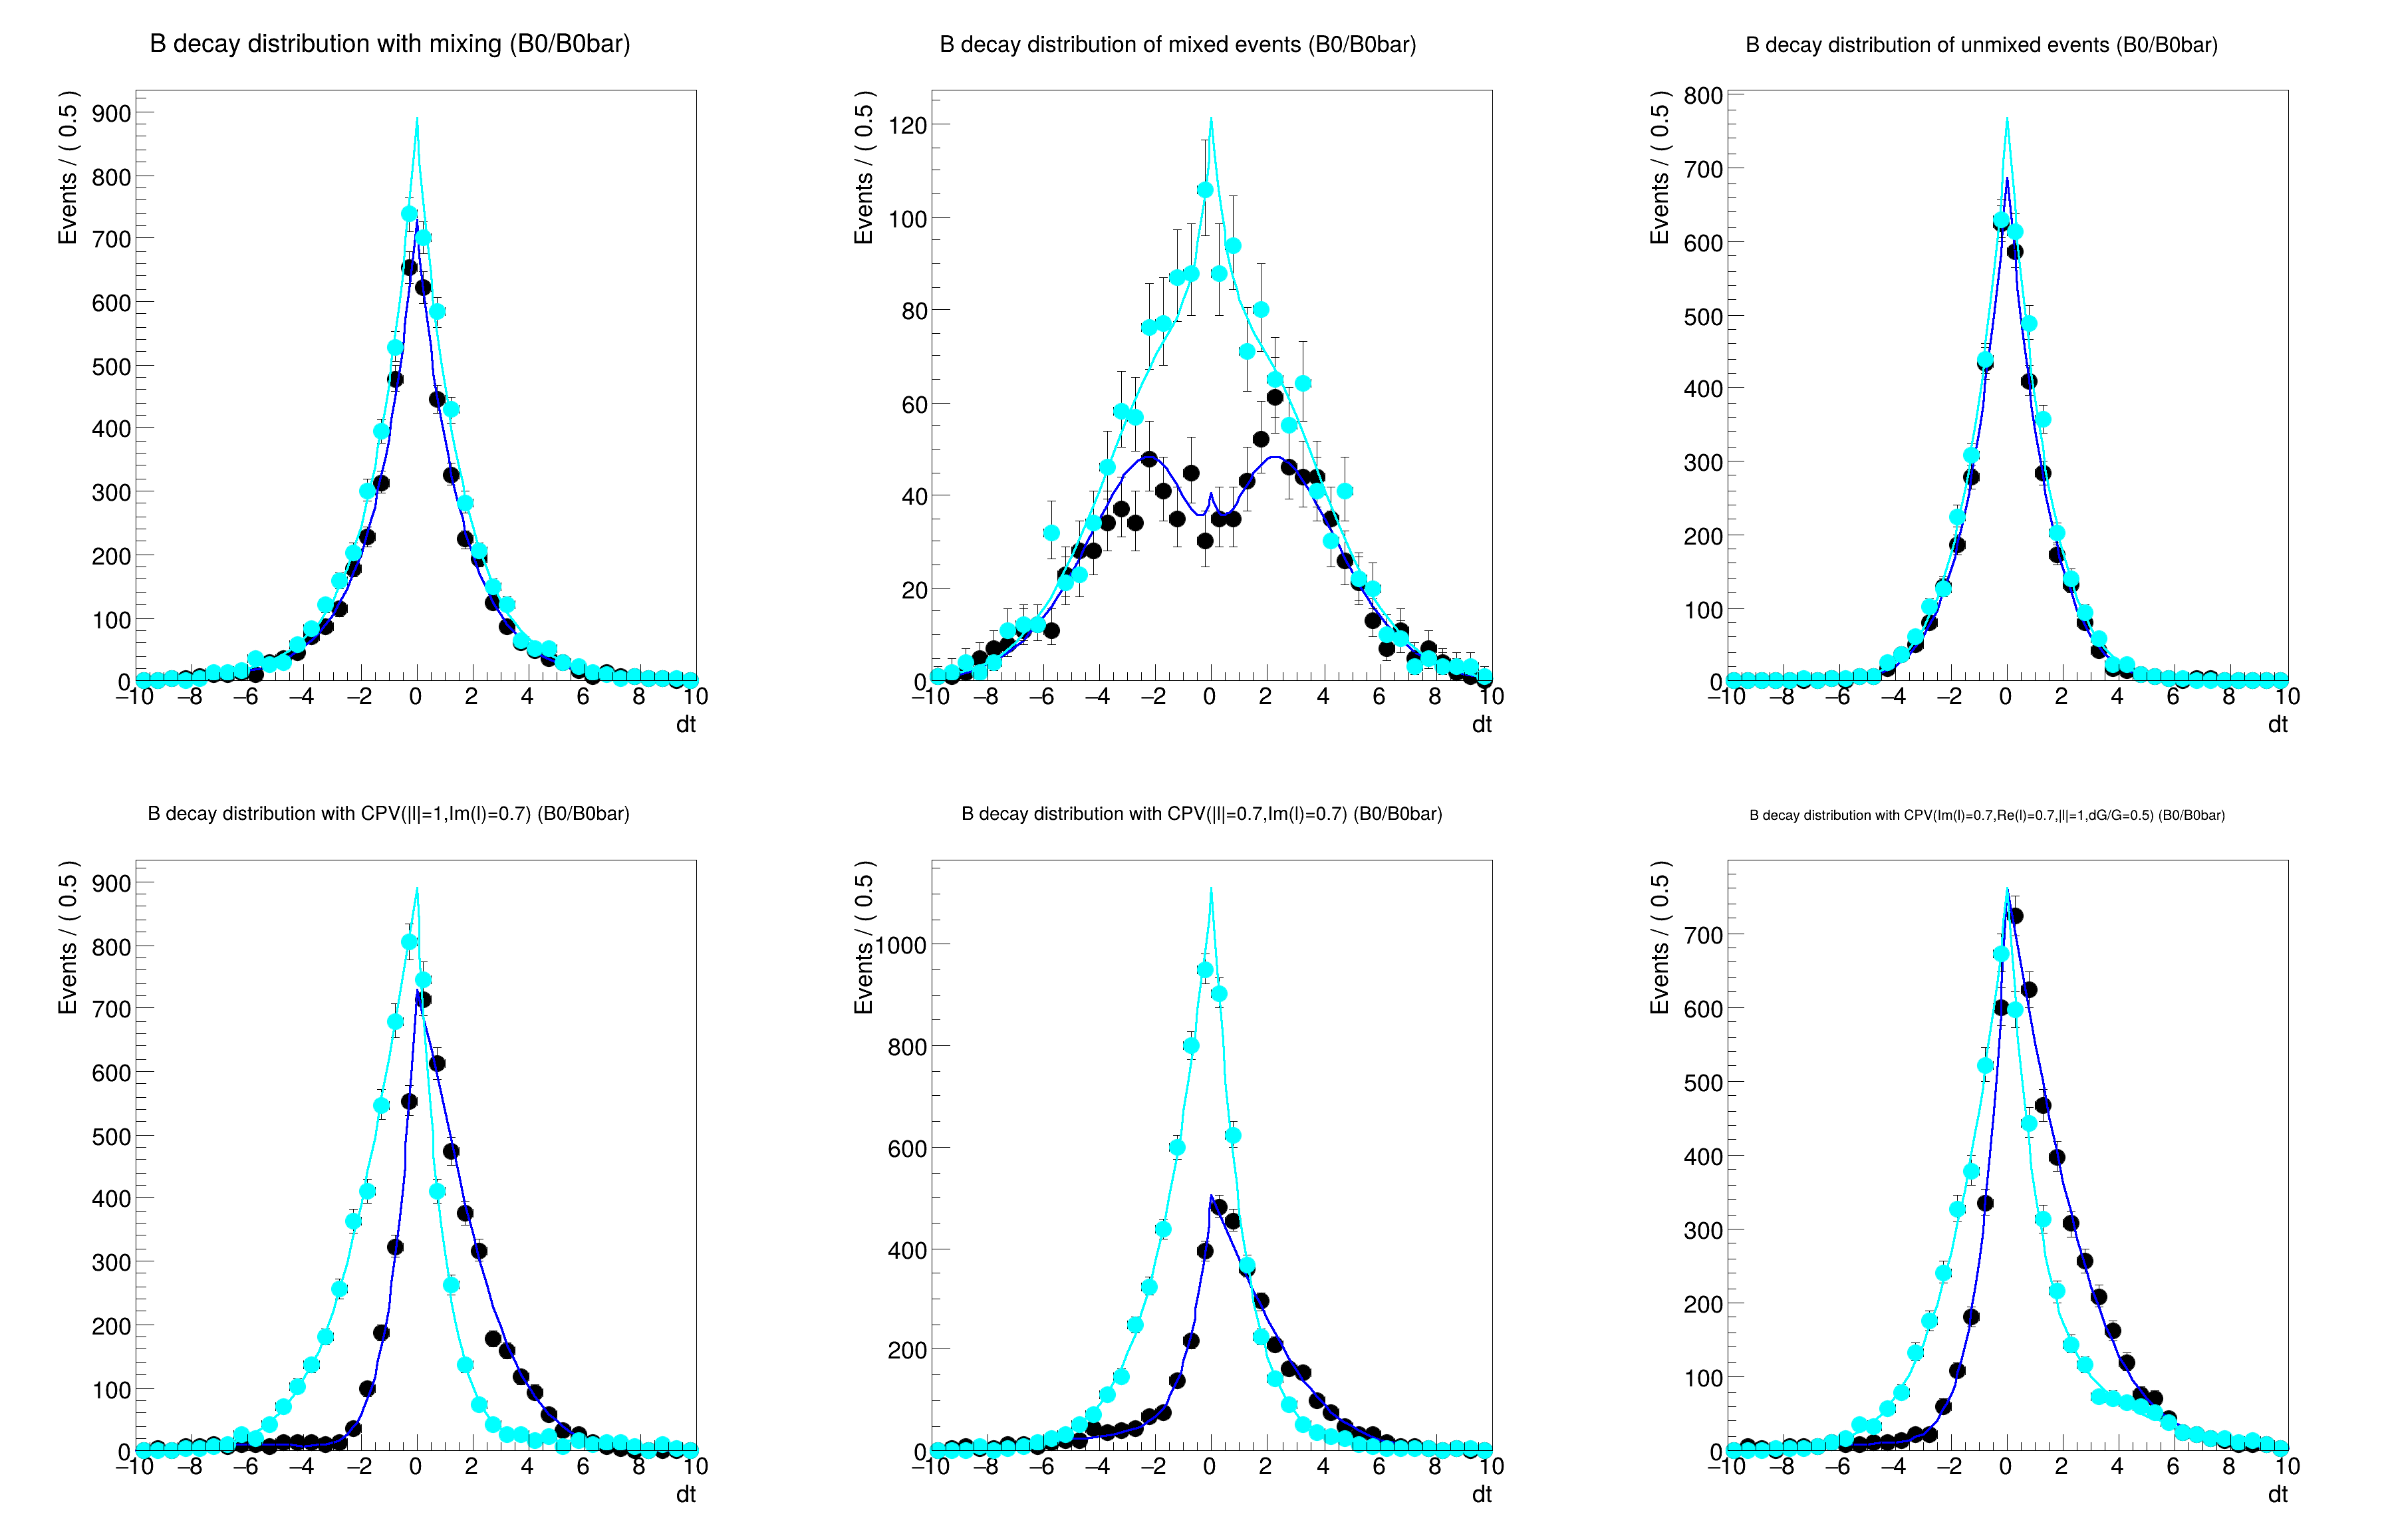
frame1 =
dt.frame(Title=
"B decay distribution with mixing (B0/B0bar)")
data.plotOn(frame1, Cut=
"tagFlav==tagFlav::B0bar", MarkerColor=
"c")
bmix.plotOn(frame1, Slice=(tagFlav,
"B0bar"), LineColor=
"c")
frame2 =
dt.frame(Title=
"B decay distribution of mixed events (B0/B0bar)")
data.plotOn(frame2, Cut=
"mixState==mixState::mixed&&tagFlav==tagFlav::B0")
bmix.plotOn(frame2, Slice={tagFlav:
"B0", mixState:
"mixed"})
data.plotOn(frame2, Cut=
"mixState==mixState::mixed&&tagFlav==tagFlav::B0bar", MarkerColor=
"c")
bmix.plotOn(frame2, Slice={tagFlav:
"B0bar", mixState:
"mixed"}, LineColor=
"c")
frame3 =
dt.frame(Title=
"B decay distribution of unmixed events (B0/B0bar)")
data.plotOn(frame3, Cut=
"mixState==mixState::unmixed&&tagFlav==tagFlav::B0")
bmix.plotOn(frame3, Slice={tagFlav:
"B0", mixState:
"unmixed"})
data.plotOn(frame3, Cut=
"mixState==mixState::unmixed&&tagFlav==tagFlav::B0bar", MarkerColor=
"c")
bmix.plotOn(frame3, Slice={tagFlav:
"B0bar", mixState:
"unmixed"}, LineColor=
"c")
"bcp", "bcp", dt, tagFlav, tau, dm, w, CPeigen, absLambda, argLambda, effR, dw, tm, type="DoubleSided"
)
frame4 =
dt.frame(Title=
"B decay distribution with CPV(|l|=1,Im(l)=0.7) (B0/B0bar)")
data2.plotOn(frame4, Cut=
"tagFlav==tagFlav::B0bar", MarkerColor=
"c")
bcp.plotOn(frame4, Slice=(tagFlav,
"B0bar"), LineColor=
"c")
frame5 =
dt.frame(Title=
"B decay distribution with CPV(|l|=0.7,Im(l)=0.7) (B0/B0bar)")
data3.plotOn(frame5, Cut=
"tagFlav==tagFlav::B0bar", MarkerColor=
"c")
bcp.plotOn(frame5, Slice=(tagFlav,
"B0bar"), LineColor=
"c")
"bcpg",
"bcpg", dt, tau, DG,
ROOT.RooFit.RooConst(1), fsinh, fcos, fsin, dm, tm, type=
"DoubleSided"
)
frame6 =
dt.frame(Title=
"B decay distribution with CPV(Im(l)=0.7,Re(l)=0.7,|l|=1,dG/G=0.5) (B0/B0bar)")
data4.plotOn(frame6, Cut=
"tagFlav==tagFlav::B0bar", MarkerColor=
"c")
bcpg.plotOn(frame6, Slice=(tagFlav,
"B0bar"), LineColor=
"c")
c =
ROOT.TCanvas(
"rf708_bphysics",
"rf708_bphysics", 1200, 800)
ROOT::Detail::TRangeCast< T, true > TRangeDynCast
TRangeDynCast is an adapter class that allows the typed iteration through a TCollection.
[#1] INFO:Plotting -- RooTreeData::plotOn: plotting 4542 events out of 10000 total events
[#1] INFO:Plotting -- RooAbsReal::plotOn(bmix) plot on dt represents a slice in (tagFlav)
[#1] INFO:Plotting -- RooAbsReal::plotOn(bmix) plot on dt integrates over variables (mixState)
[#1] INFO:Plotting -- RooTreeData::plotOn: plotting 5458 events out of 10000 total events
[#1] INFO:Plotting -- RooAbsReal::plotOn(bmix) plot on dt represents a slice in (tagFlav)
[#1] INFO:Plotting -- RooAbsReal::plotOn(bmix) plot on dt integrates over variables (mixState)
[#1] INFO:Plotting -- RooTreeData::plotOn: plotting 933 events out of 10000 total events
[#1] INFO:Plotting -- RooAbsReal::plotOn(bmix) plot on dt represents a slice in (mixState,tagFlav)
[#1] INFO:Plotting -- RooTreeData::plotOn: plotting 1461 events out of 10000 total events
[#1] INFO:Plotting -- RooAbsReal::plotOn(bmix) plot on dt represents a slice in (mixState,tagFlav)
[#1] INFO:Plotting -- RooTreeData::plotOn: plotting 3609 events out of 10000 total events
[#1] INFO:Plotting -- RooAbsReal::plotOn(bmix) plot on dt represents a slice in (mixState,tagFlav)
[#1] INFO:Plotting -- RooTreeData::plotOn: plotting 3997 events out of 10000 total events
[#1] INFO:Plotting -- RooAbsReal::plotOn(bmix) plot on dt represents a slice in (mixState,tagFlav)
[#1] INFO:Plotting -- RooTreeData::plotOn: plotting 4495 events out of 10000 total events
[#1] INFO:Plotting -- RooAbsReal::plotOn(bcp) plot on dt represents a slice in (tagFlav)
[#1] INFO:Plotting -- RooTreeData::plotOn: plotting 5505 events out of 10000 total events
[#1] INFO:Plotting -- RooAbsReal::plotOn(bcp) plot on dt represents a slice in (tagFlav)
[#1] INFO:Plotting -- RooTreeData::plotOn: plotting 3617 events out of 10000 total events
[#1] INFO:Plotting -- RooAbsReal::plotOn(bcp) plot on dt represents a slice in (tagFlav)
[#1] INFO:Plotting -- RooTreeData::plotOn: plotting 6383 events out of 10000 total events
[#1] INFO:Plotting -- RooAbsReal::plotOn(bcp) plot on dt represents a slice in (tagFlav)
[#1] INFO:Plotting -- RooTreeData::plotOn: plotting 4991 events out of 10000 total events
[#1] INFO:Plotting -- RooAbsReal::plotOn(bcpg) plot on dt represents a slice in (tagFlav)
[#1] INFO:Plotting -- RooTreeData::plotOn: plotting 5009 events out of 10000 total events
[#1] INFO:Plotting -- RooAbsReal::plotOn(bcpg) plot on dt represents a slice in (tagFlav)