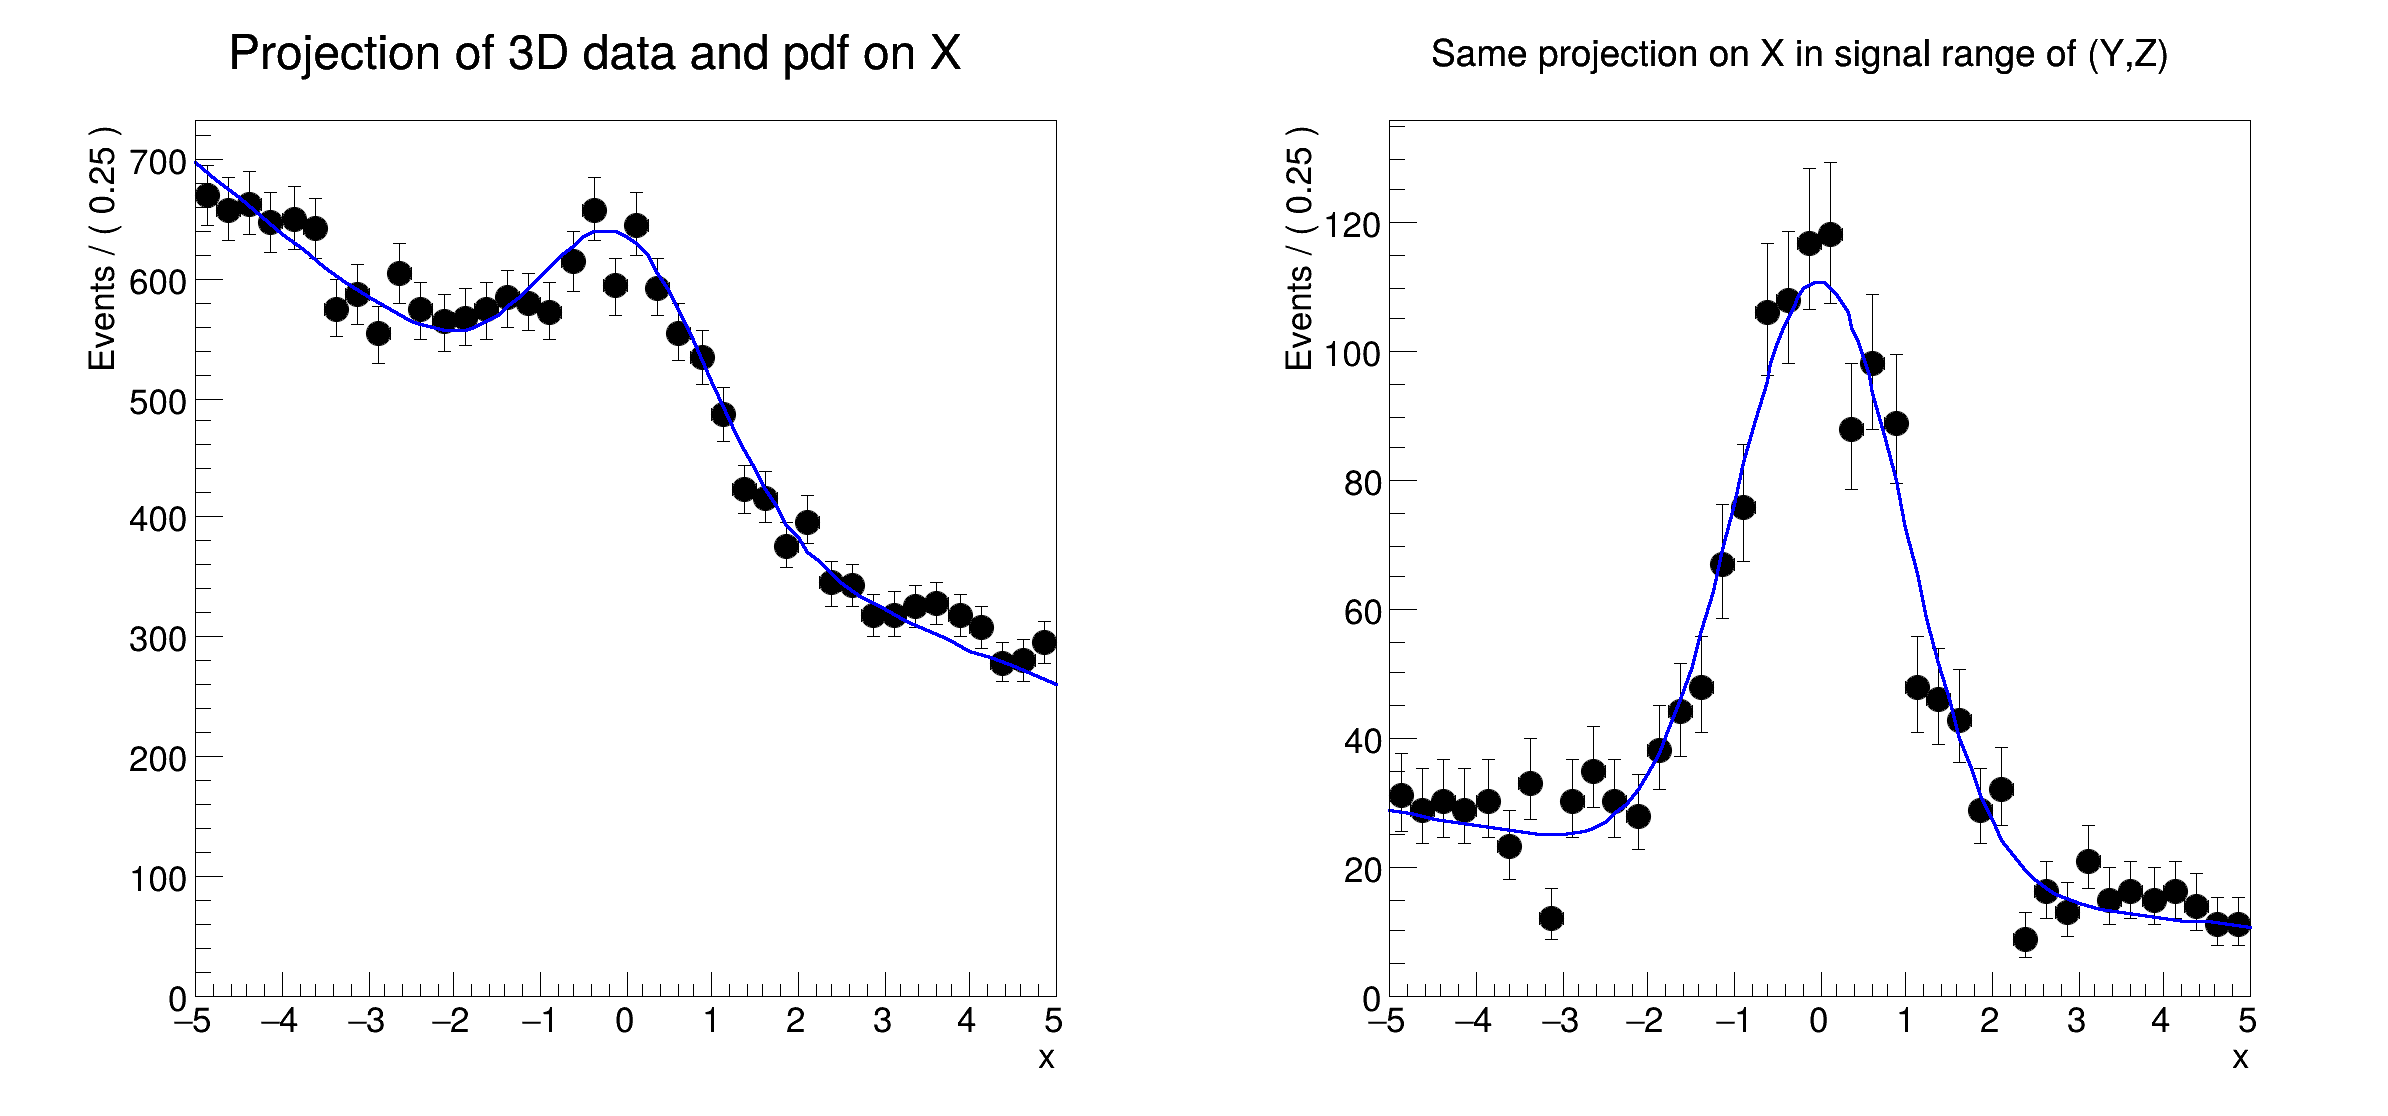

Multidimensional models: projecting pdf and data ranges in continuous observables

void rf311_rangeplot()
{
std::unique_ptr<RooDataSet>
data{model.generate({
x,
y, z}, 20000)};
model.plotOn(frame);
y.setRange(
"sigRegion", -1, 1);
z.setRange("sigRegion", -1, 1);
gPad->SetLeftMargin(0.15);
gPad->SetLeftMargin(0.15);
frame2->GetYaxis()->SetTitleOffset(1.4);
}
ROOT::Detail::TRangeCast< T, true > TRangeDynCast
TRangeDynCast is an adapter class that allows the typed iteration through a TCollection.
Option_t Option_t TPoint TPoint const char GetTextMagnitude GetFillStyle GetLineColor GetLineWidth GetMarkerStyle GetTextAlign GetTextColor GetTextSize void data
Efficient implementation of a sum of PDFs of the form.
RooArgList is a container object that can hold multiple RooAbsArg objects.
RooArgSet is a container object that can hold multiple RooAbsArg objects.
Plot frame and a container for graphics objects within that frame.
static RooPlot * frame(const RooAbsRealLValue &var, double xmin, double xmax, Int_t nBins)
Create a new frame for a given variable in x.
void Draw(Option_t *options=nullptr) override
Draw this plot and all of the elements it contains.
RooPolynomial implements a polynomial p.d.f of the form.
Efficient implementation of a product of PDFs of the form.
Variable that can be changed from the outside.
virtual void SetTitleOffset(Float_t offset=1)
Set distance between the axis and the axis title.
RooCmdArg Bins(Int_t nbin)
RooCmdArg ProjectionRange(const char *rangeName)
RooCmdArg CutRange(const char *rangeName)
The namespace RooFit contains mostly switches that change the behaviour of functions of PDFs (or othe...
[#1] INFO:Plotting -- RooAbsReal::plotOn(model) plot on x integrates over variables (y,z)
[#1] INFO:Eval -- RooRealVar::setRange(y) new range named 'sigRegion' created with bounds [-1,1]
[#1] INFO:Eval -- RooRealVar::setRange(z) new range named 'sigRegion' created with bounds [-1,1]
[#1] INFO:Plotting -- RooTreeData::plotOn: plotting 1692 events out of 20000 total events
[#1] INFO:Plotting -- RooAbsReal::plotOn(model) plot on x integrates over variables (y,z) in range sigRegion
- Date
- July 2008
- Author
- Wouter Verkerke
Definition in file rf311_rangeplot.C.


