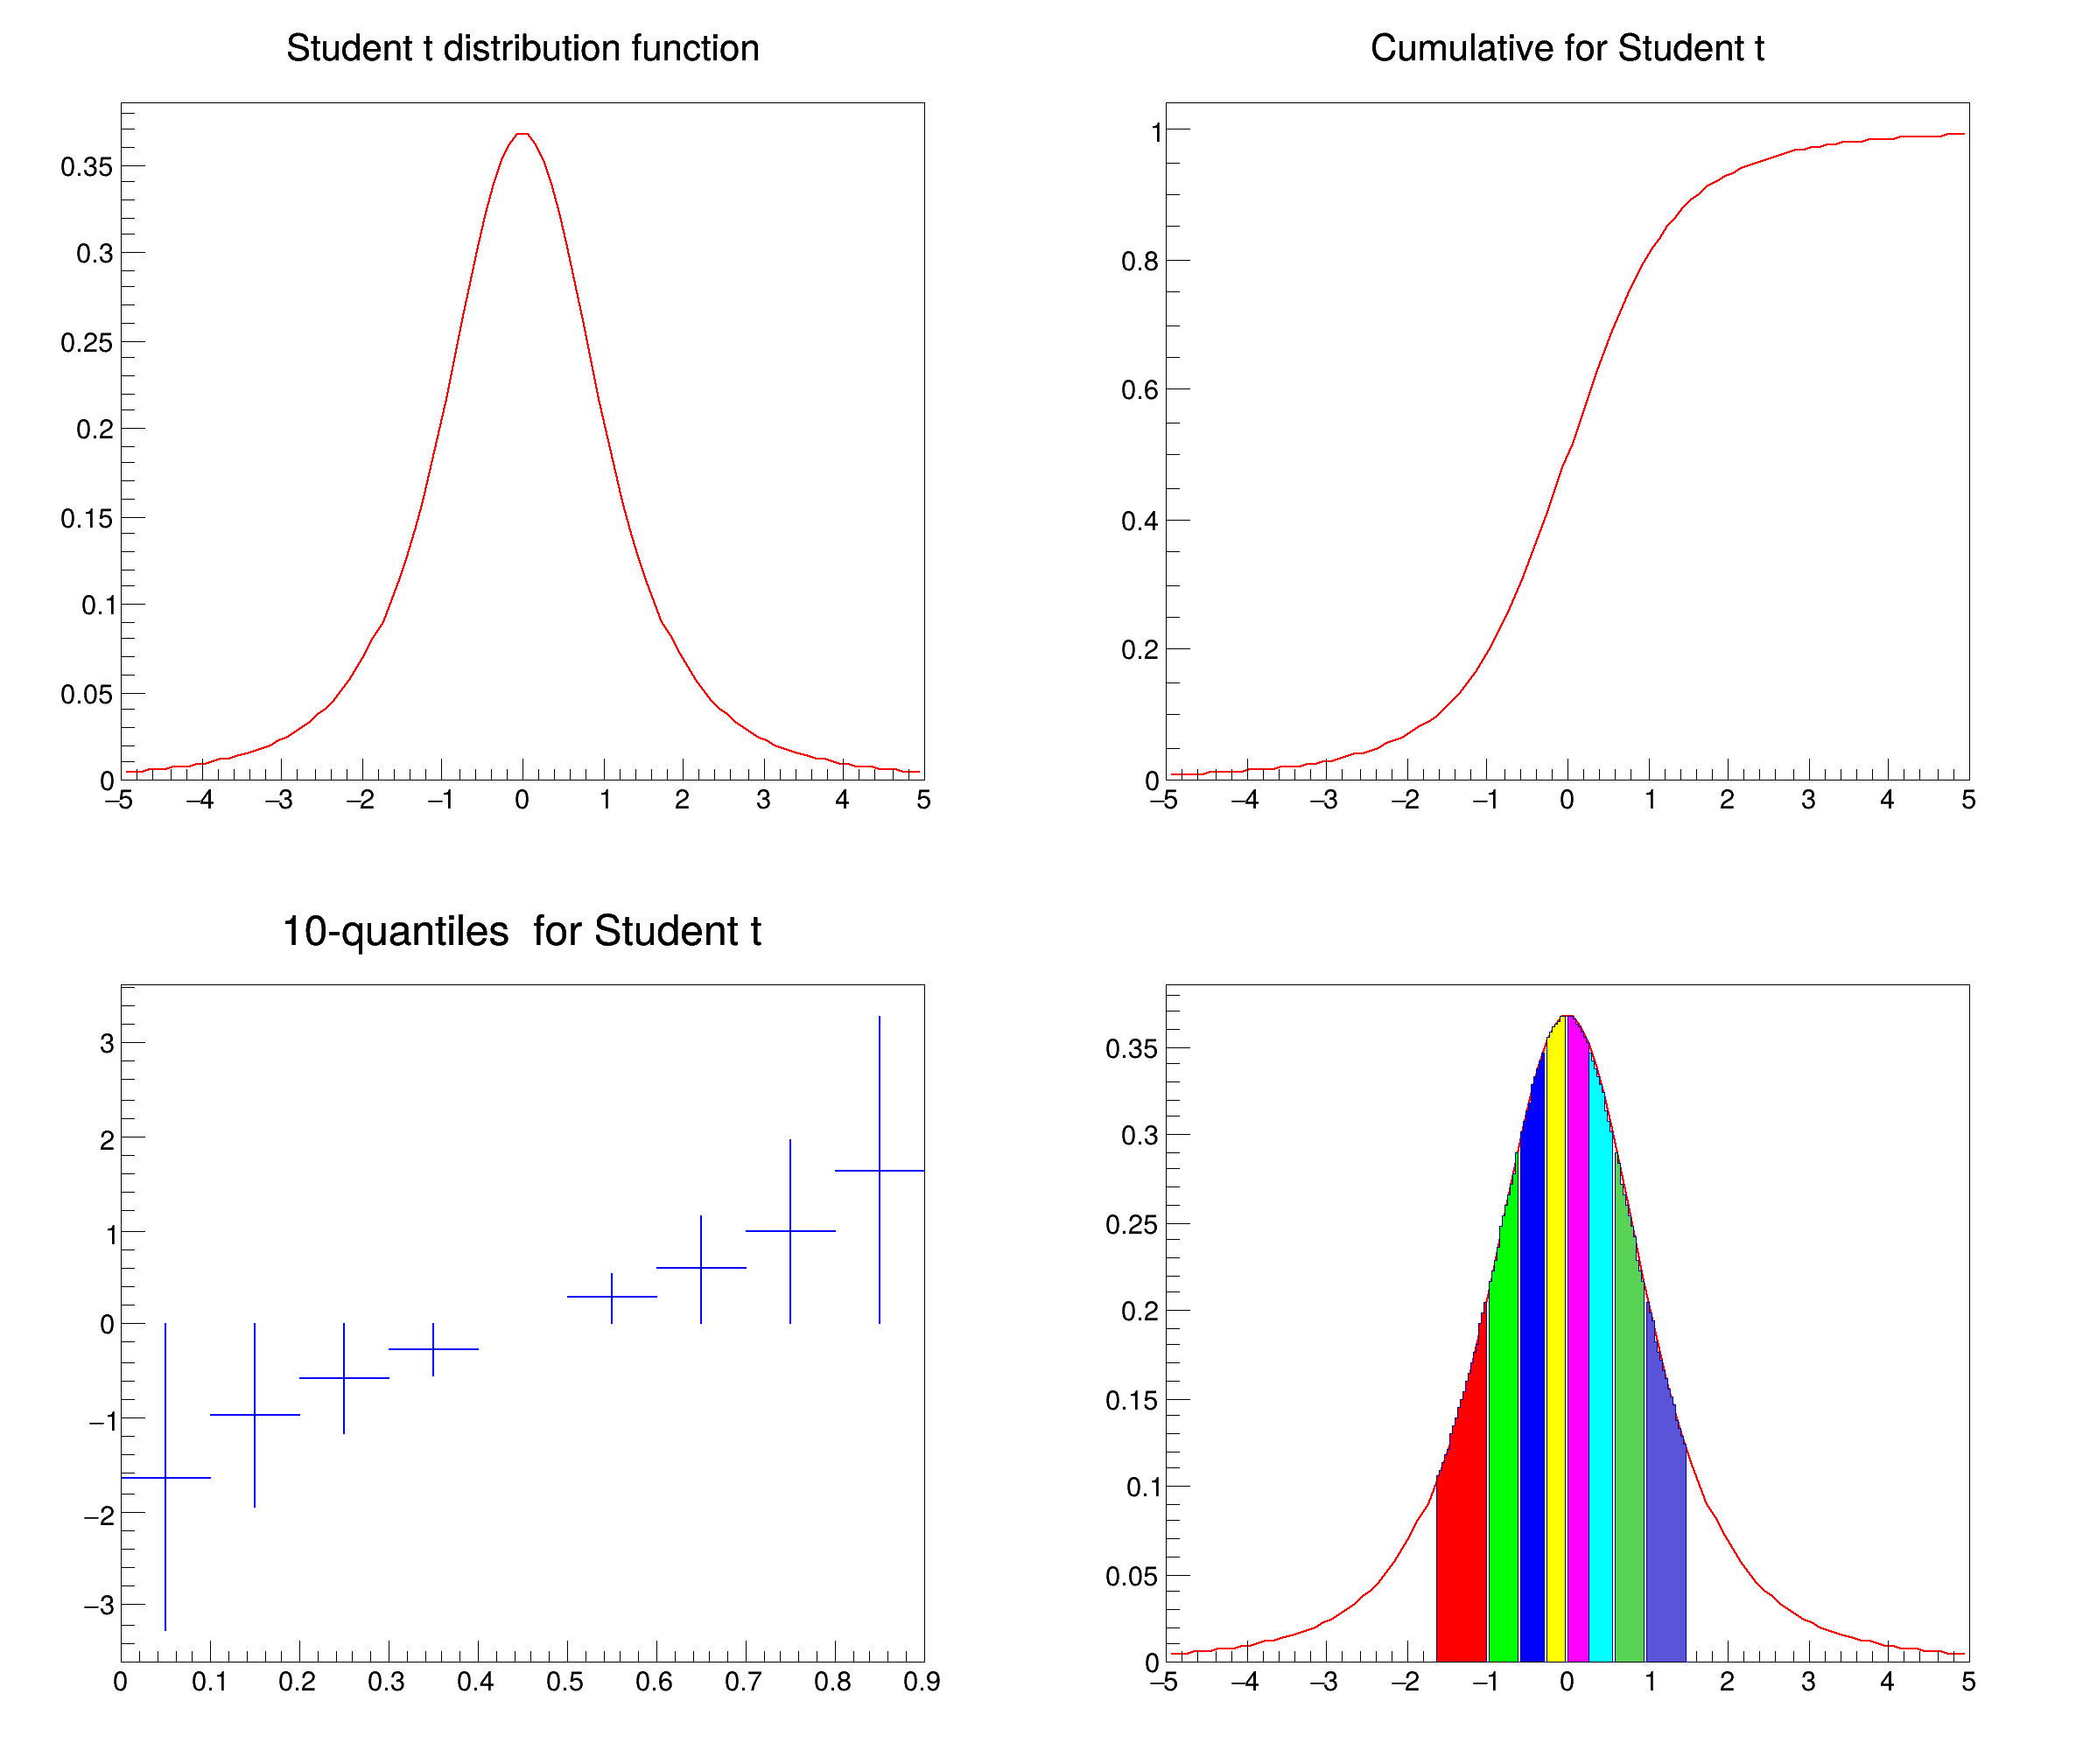

Example macro describing the student t distribution
It draws the pdf, the cdf and then 10 quantiles of the t Student distribution
based on Magdalena Slawinska's tStudent.C
from ROOT import TH1D, TF1, TCanvas, kRed, kBlue
import ROOT
import numpy as np
n = 100
a = -5.
b = 5.
pdf =
TF1(
"pdf",
"ROOT::Math::tdistribution_pdf(x,3.0)", a, b)
cum =
TF1(
"cum",
"ROOT::Math::tdistribution_cdf(x,3.0)", a, b)
quant =
TH1D(
"quant",
"", 9, 0, 0.9)
)
xx = []
pdfq = []
nbin =
int(n * (xx[i+1] - xx[i]) / 3.0 + 1.0)
name = "pdf%d" % i
x = j * (xx[i+1] - xx[i]) / nbin + xx[i]
Canvas =
TCanvas(
"DistCanvas",
"Student Distribution graphs", 10, 10, 800, 700)
pdfq[0].SetTitle("Student t & its quantiles")
pdfq[0].SetTitle("Student t & its quantiles")
i = 1
for pd in pdfq[1:]:
i += 1
ROOT::Detail::TRangeCast< T, true > TRangeDynCast
TRangeDynCast is an adapter class that allows the typed iteration through a TCollection.
1-D histogram with a double per channel (see TH1 documentation)
- Author
- Juan Fernando Jaramillo Botero
Definition in file pdf012_tStudent.py.