

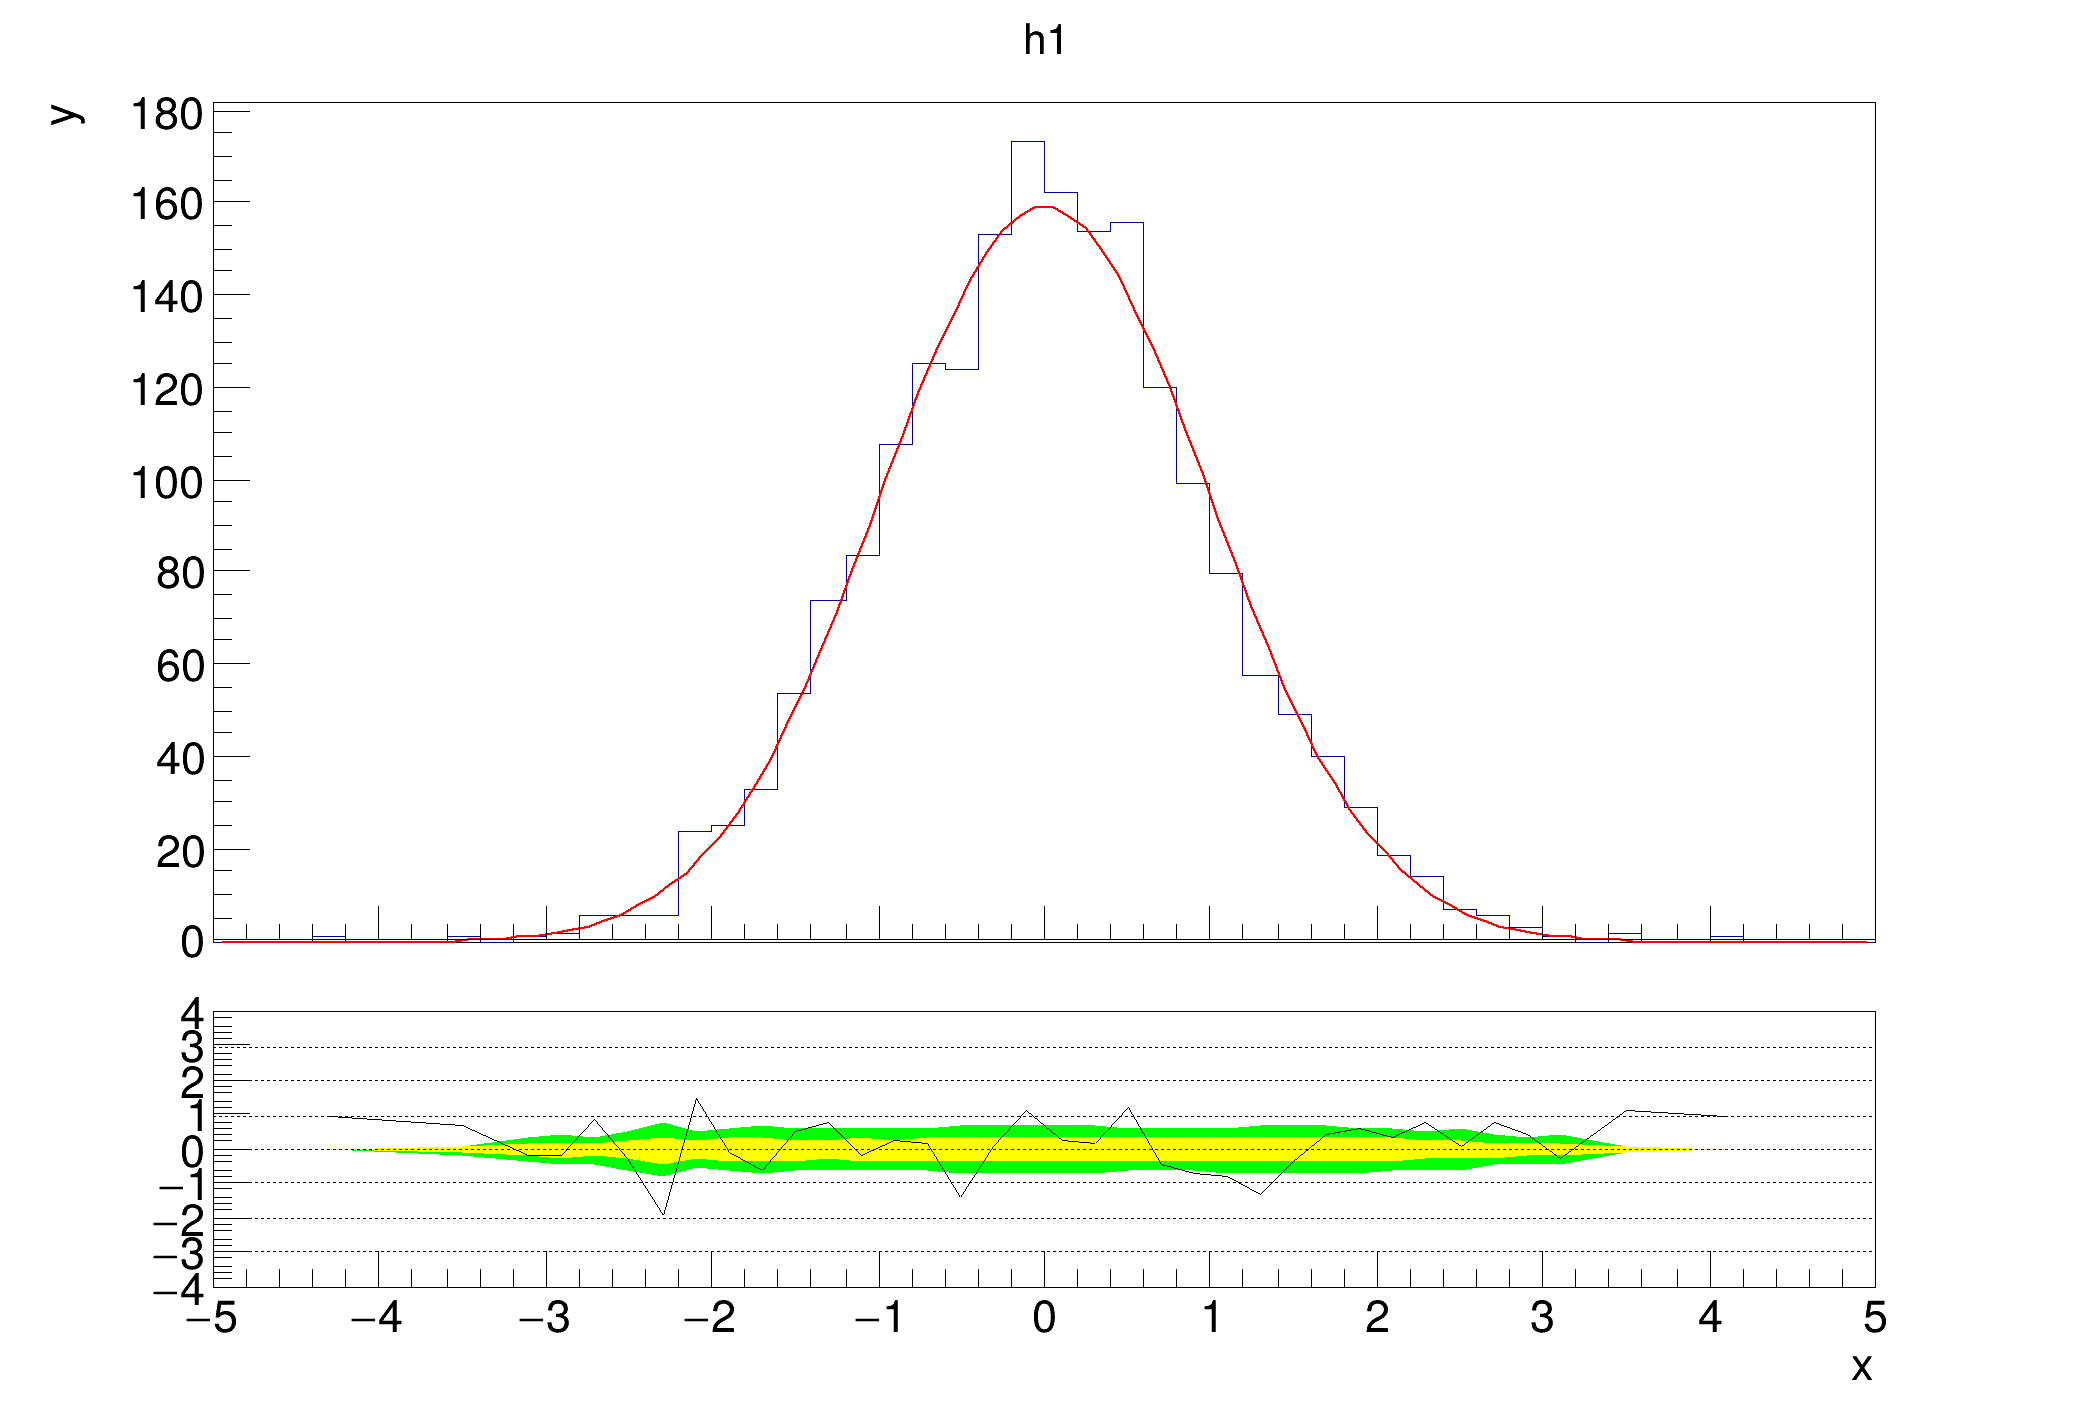
 Example that shows custom dashed lines on the lower plot, specified by a vector of floats.
By default, dashed lines are drawn at certain points. You can either disable them, or specify where you want them to appear.
void hist032_TRatioPlot_fit_lines()
{
auto c1 =
new TCanvas(
"c1",
"fit residual simple");
auto h1 =
new TH1D(
"h1",
"h1", 50, -5, 5);
std::vector<double>
lines = {-3, -2, -1, 0, 1, 2, 3};
rp1->GetLowerRefGraph()->SetMinimum(-4);
rp1->GetLowerRefGraph()->SetMaximum(4);
}
R__EXTERN TStyle * gStyle
1-D histogram with a double per channel (see TH1 documentation)
virtual void FillRandom(TF1 *f1, Int_t ntimes=5000, TRandom *rng=nullptr)
virtual TFitResultPtr Fit(const char *formula, Option_t *option="", Option_t *goption="", Double_t xmin=0, Double_t xmax=0)
Fit histogram with function fname.
virtual void SetTitle(const char *title="")
Set the title of the TNamed.
Class for displaying ratios, differences and fit residuals.
void SetOptStat(Int_t stat=1)
The type of information printed in the histogram statistics box can be selected via the parameter mod...
- Date
- January 2020
- Author
- Paul Gessinger
Definition in file hist032_TRatioPlot_fit_lines.C.