 |
ROOT
Reference Guide |

|
| |
ROOT
Reference Guide |
|

![]()
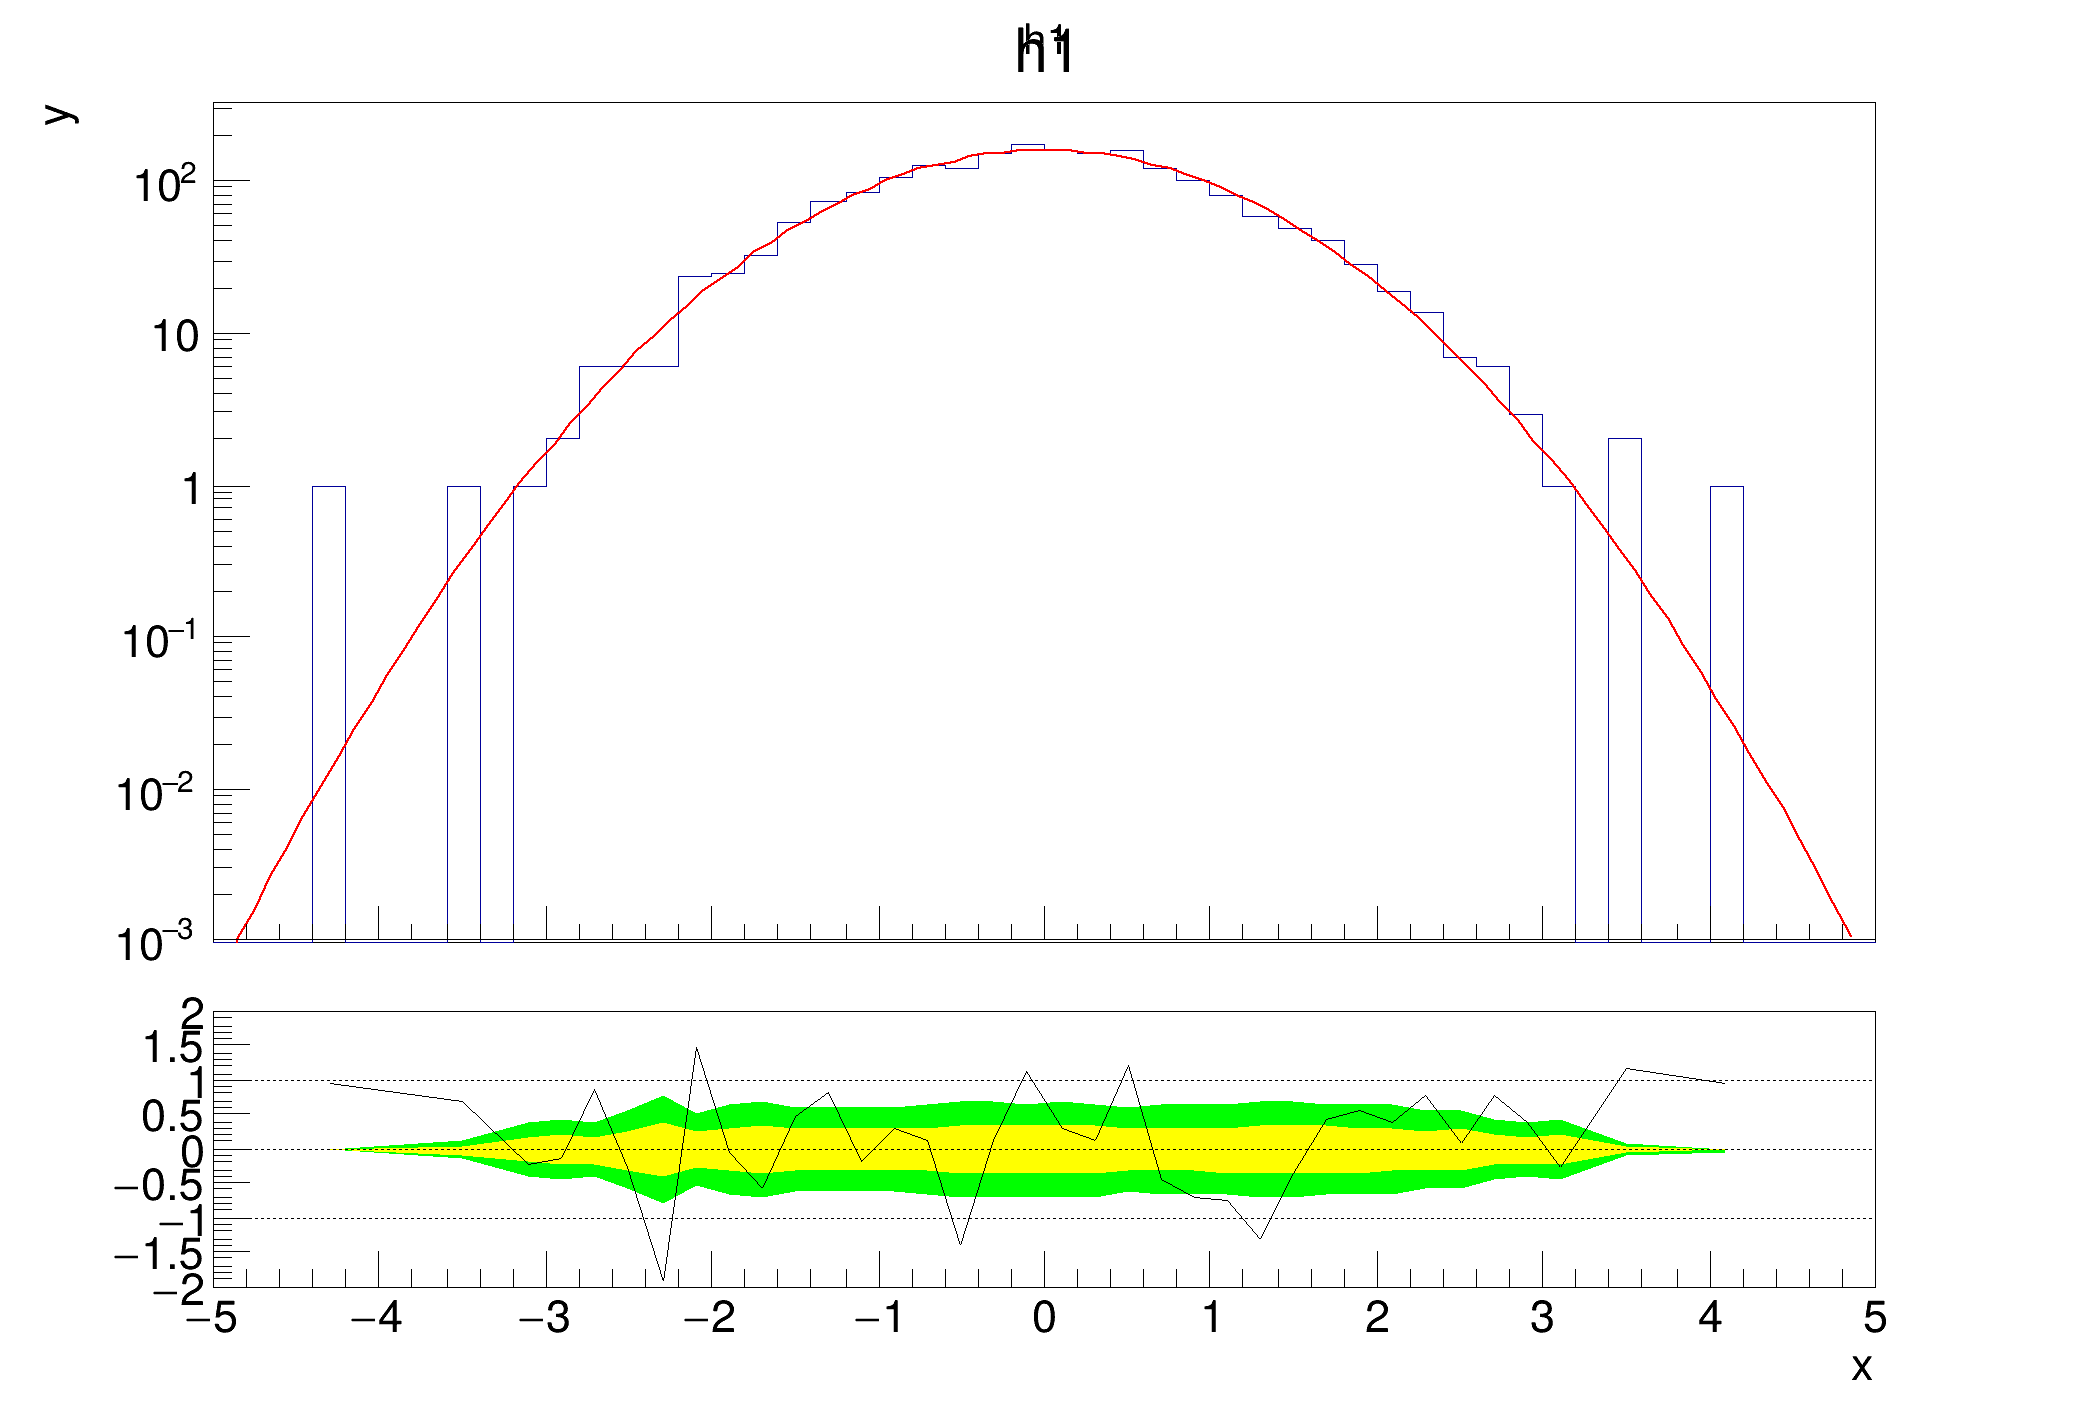
Example which shows how you can get the graph of the lower plot and set the y axis range for it.
Since the lower plot is not created until TRatioPlot::Draw is called, you can only use the method afterwards. Inspired by the tutorial of Paul Gessinger.
Definition in file hist031_TRatioPlot_residual_fit.py.
