

 Draw a 1D histogram to a canvas.
- Note
- When using graphics inside a ROOT macro the objects must be created with
new.
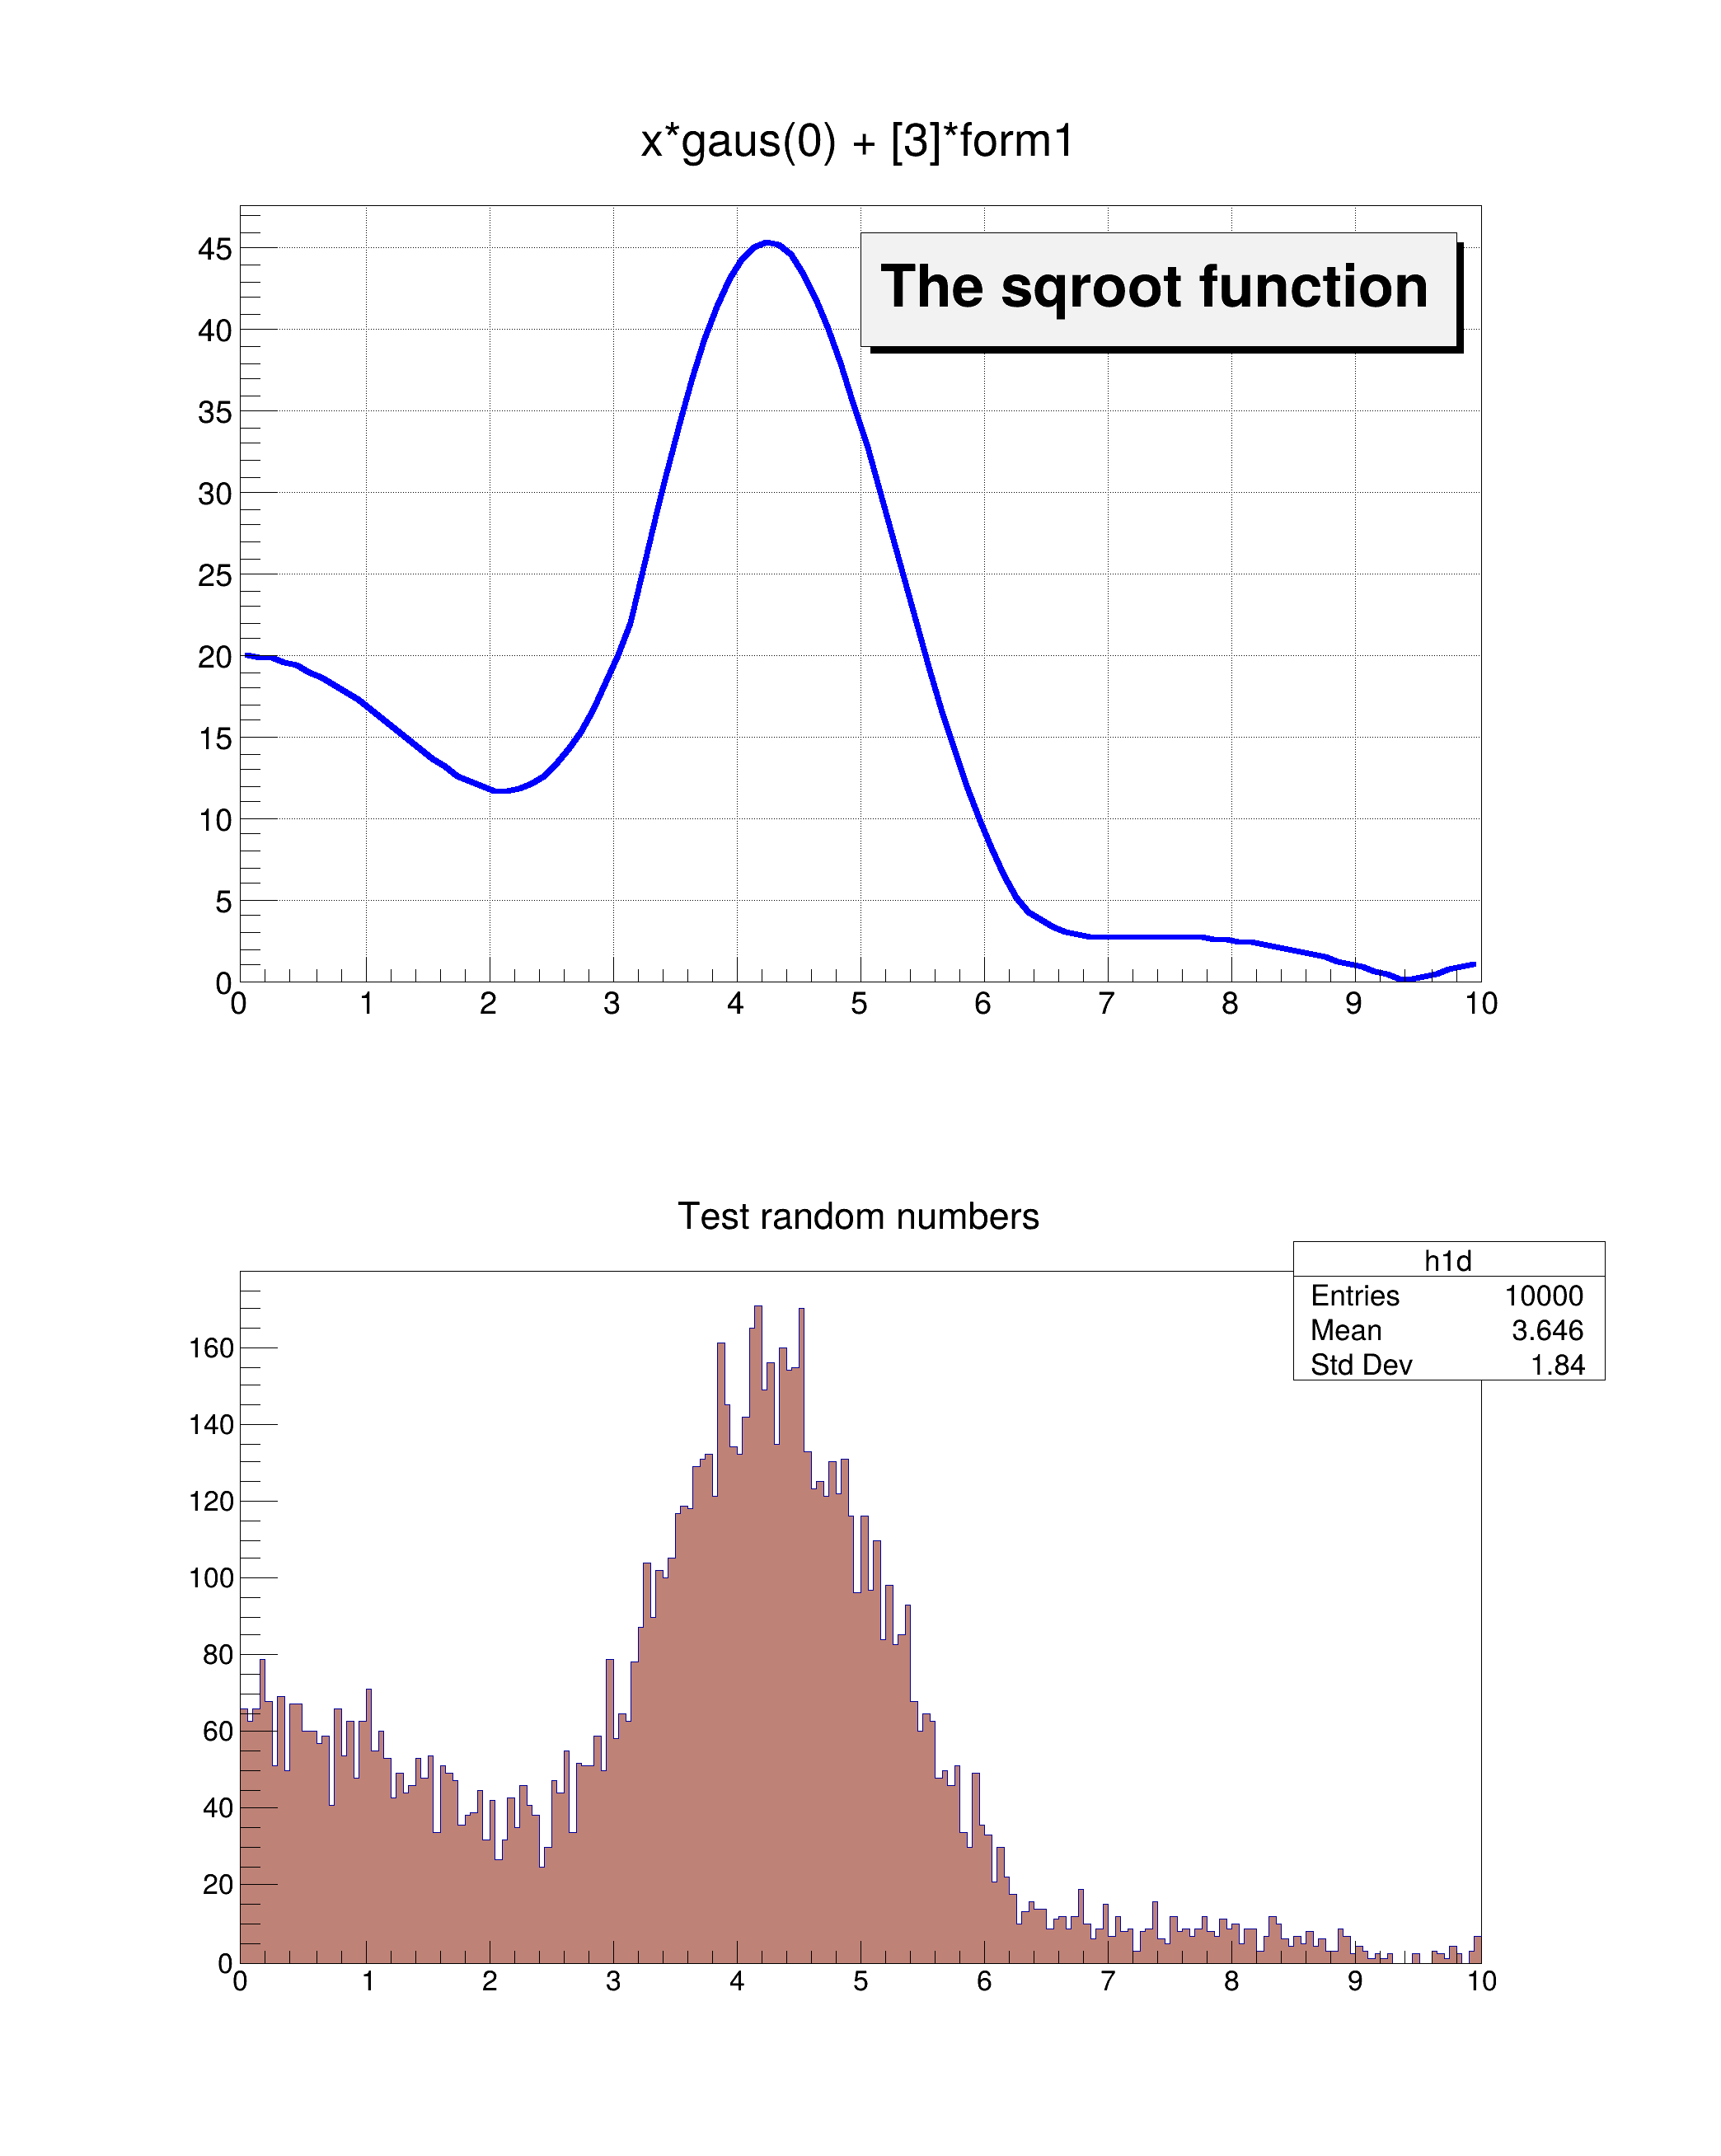
void hist003_TH1_draw()
{
sqroot->SetParameters(10.0, 4.0, 1.0, 20.0);
int nBins = 200;
h1d->FillRandom(
"sqroot", 10000);
auto *
pad1 =
new TPad(
"pad1",
"The pad with the function", 0.05, 0.50, 0.95, 0.95);
auto *
pad2 =
new TPad(
"pad2",
"The pad with the histogram", 0.05, 0.05, 0.95, 0.45);
pad1->GetFrame()->SetBorderMode(-1);
pad1->GetFrame()->SetBorderSize(5);
pad2->GetFrame()->SetBorderMode(-1);
pad2->GetFrame()->SetBorderSize(5);
}
Option_t Option_t TPoint TPoint const char GetTextMagnitude GetFillStyle GetLineColor GetLineWidth GetMarkerStyle GetTextAlign GetTextColor GetTextSize void char Point_t Rectangle_t height
1-D histogram with a double per channel (see TH1 documentation)
The most important graphics class in the ROOT system.
A Pave (see TPave) with a text centered in the Pave.
- Date
- November 2024
- Author
- Rene Brun, Giacomo Parolini
Definition in file hist003_TH1_draw.C.