****************************************
Minimizer is Minuit2 / Migrad
Chi2 = 4.25425e+06
NDf = 398
Edm = 5.85197e-13
NCalls = 45
p0 = 0.574556 +/- 0.109977
p1 = 1.72367 +/- 0.329932
{
auto c =
new TCanvas(
"c",
"Graph2D example",0,0,600,800);
int nd = 400;
double fl = 6;
auto f2 =
new TF2(
"f2",
"1000*(([0]*sin(x)/x)*([1]*sin(y)/y))+200",
-fl,fl,-fl,fl);
f2->SetParameters(1,1);
double zmax = 0;
for (
int N=0;
N<nd;
N++) {
z = f2->Eval(
x,
y)*(1+
rnd);
if (z>zmax) zmax = z;
}
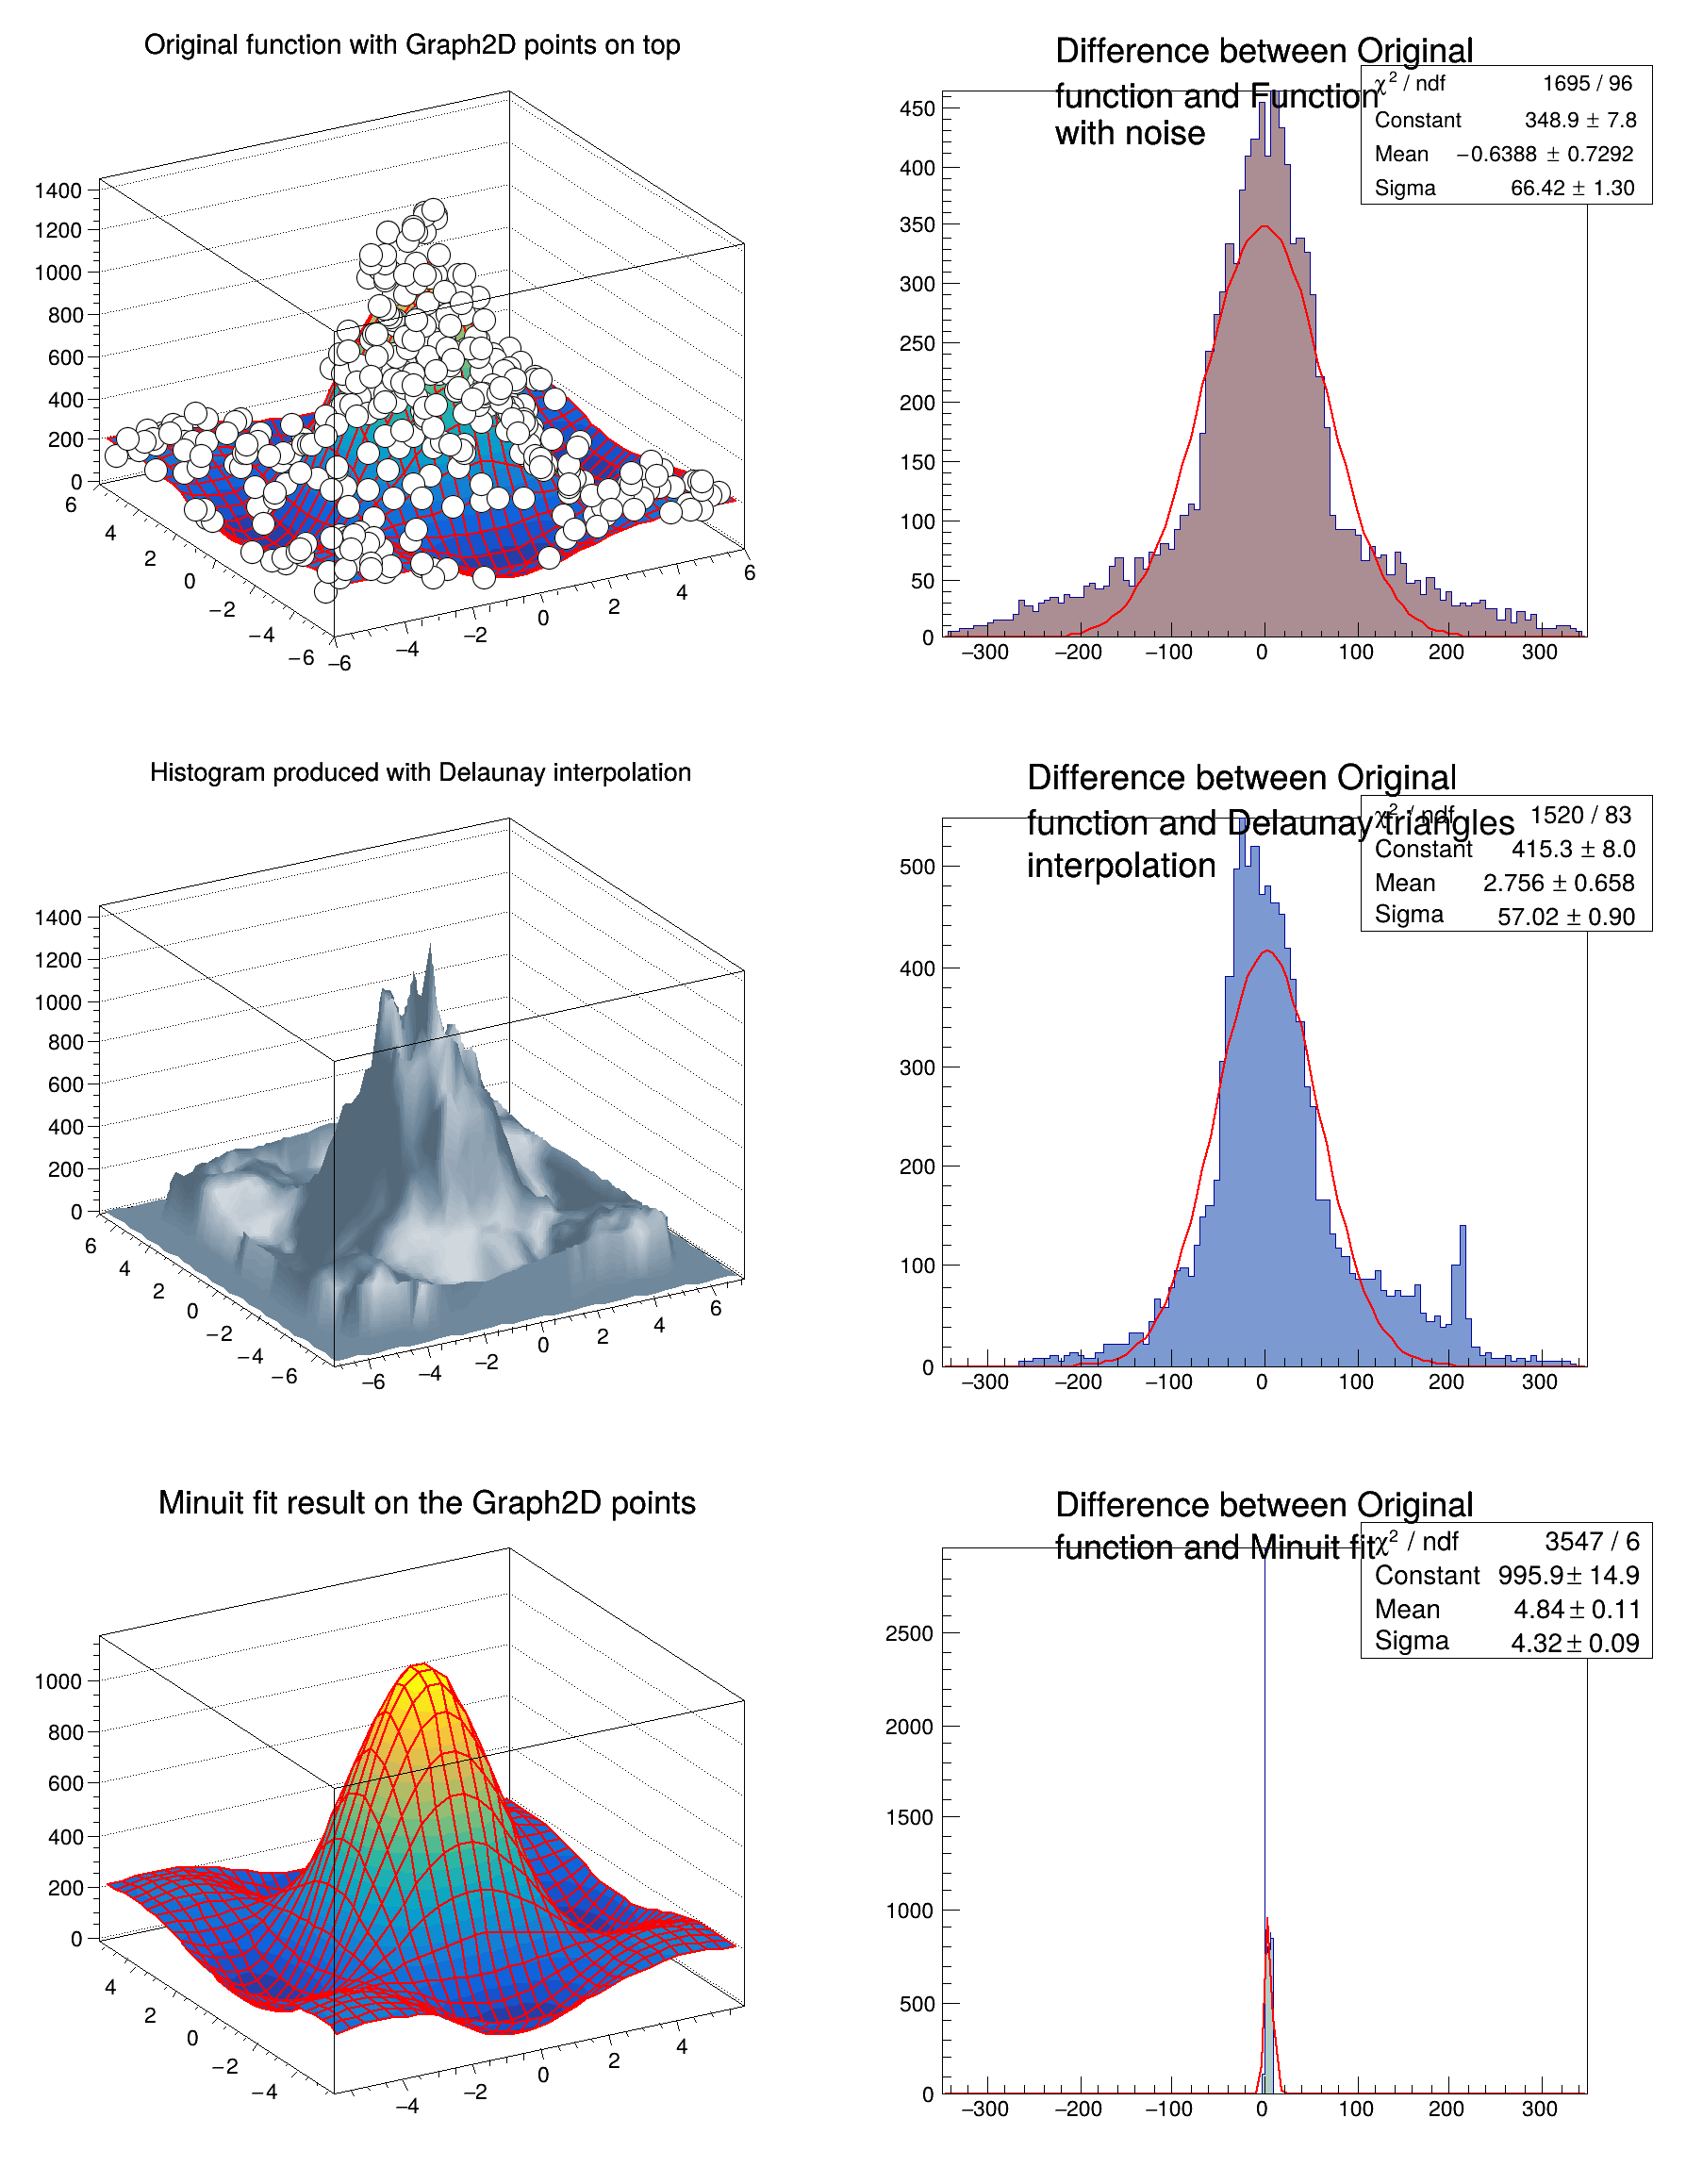
"#splitline{Difference between Original}{#splitline{function and Function}{with noise}}",
"#splitline{Difference between Original}{#splitline{function and Delaunay triangles}{interpolation}}",
"#splitline{Difference between Original}{function and Minuit fit}",
f2->SetParameters(0.5,1.5);
f2->SetParameters(1,1);
for (
int N=0;
N<
np;
N++) {
z = f2->Eval(
x,
y)*(1+
rnd);
z =
dt->Interpolate(
x,
y);
h2->Fill(f2->Eval(
x,
y)-z);
h3->Fill(f2->Eval(
x,
y)-z);
}
f2->SetTitle("Original function with Graph2D points on top");
f2->SetMaximum(zmax);
f2->Draw("surf1");
dt->SetTitle(
"Histogram produced with Delaunay interpolation");
fit2->SetTitle(
"Minuit fit result on the Graph2D points");
h2->SetFillColor(38);
h3->SetFillColor(29);
h2->Draw();
h3->Draw();
}
ROOT::Detail::TRangeCast< T, true > TRangeDynCast
TRangeDynCast is an adapter class that allows the typed iteration through a TCollection.
Option_t Option_t TPoint TPoint const char GetTextMagnitude GetFillStyle GetLineColor GetLineWidth GetMarkerStyle GetTextAlign GetTextColor GetTextSize void char Point_t Rectangle_t WindowAttributes_t Float_t Float_t Float_t Int_t Int_t UInt_t UInt_t Rectangle_t Int_t Int_t Window_t TString Int_t GCValues_t GetPrimarySelectionOwner GetDisplay GetScreen GetColormap GetNativeEvent const char const char dpyName wid window const char font_name cursor keysym reg const char only_if_exist regb h Point_t np
Option_t Option_t TPoint TPoint const char GetTextMagnitude GetFillStyle GetLineColor GetLineWidth GetMarkerStyle GetTextAlign GetTextColor GetTextSize void char Point_t Rectangle_t WindowAttributes_t Float_t r
R__EXTERN TStyle * gStyle
virtual void SetFillColor(Color_t fcolor)
Set the fill area color.
A 2-Dim function with parameters.
Graphics object made of three arrays X, Y and Z with the same number of points each.
1-D histogram with a double per channel (see TH1 documentation)
virtual TFitResultPtr Fit(const char *formula, Option_t *option="", Option_t *goption="", Double_t xmin=0, Double_t xmax=0)
Fit histogram with function fname.
virtual Int_t Fill(Double_t x)
Increment bin with abscissa X by 1.
void Draw(Option_t *option="") override
Draw this histogram with options.
This is the base class for the ROOT Random number generators.
void SetOptStat(Int_t stat=1)
The type of information printed in the histogram statistics box can be selected via the parameter mod...
void SetHistTopMargin(Double_t hmax=0.05)
void SetOptFit(Int_t fit=1)
The type of information about fit parameters printed in the histogram statistics box can be selected ...