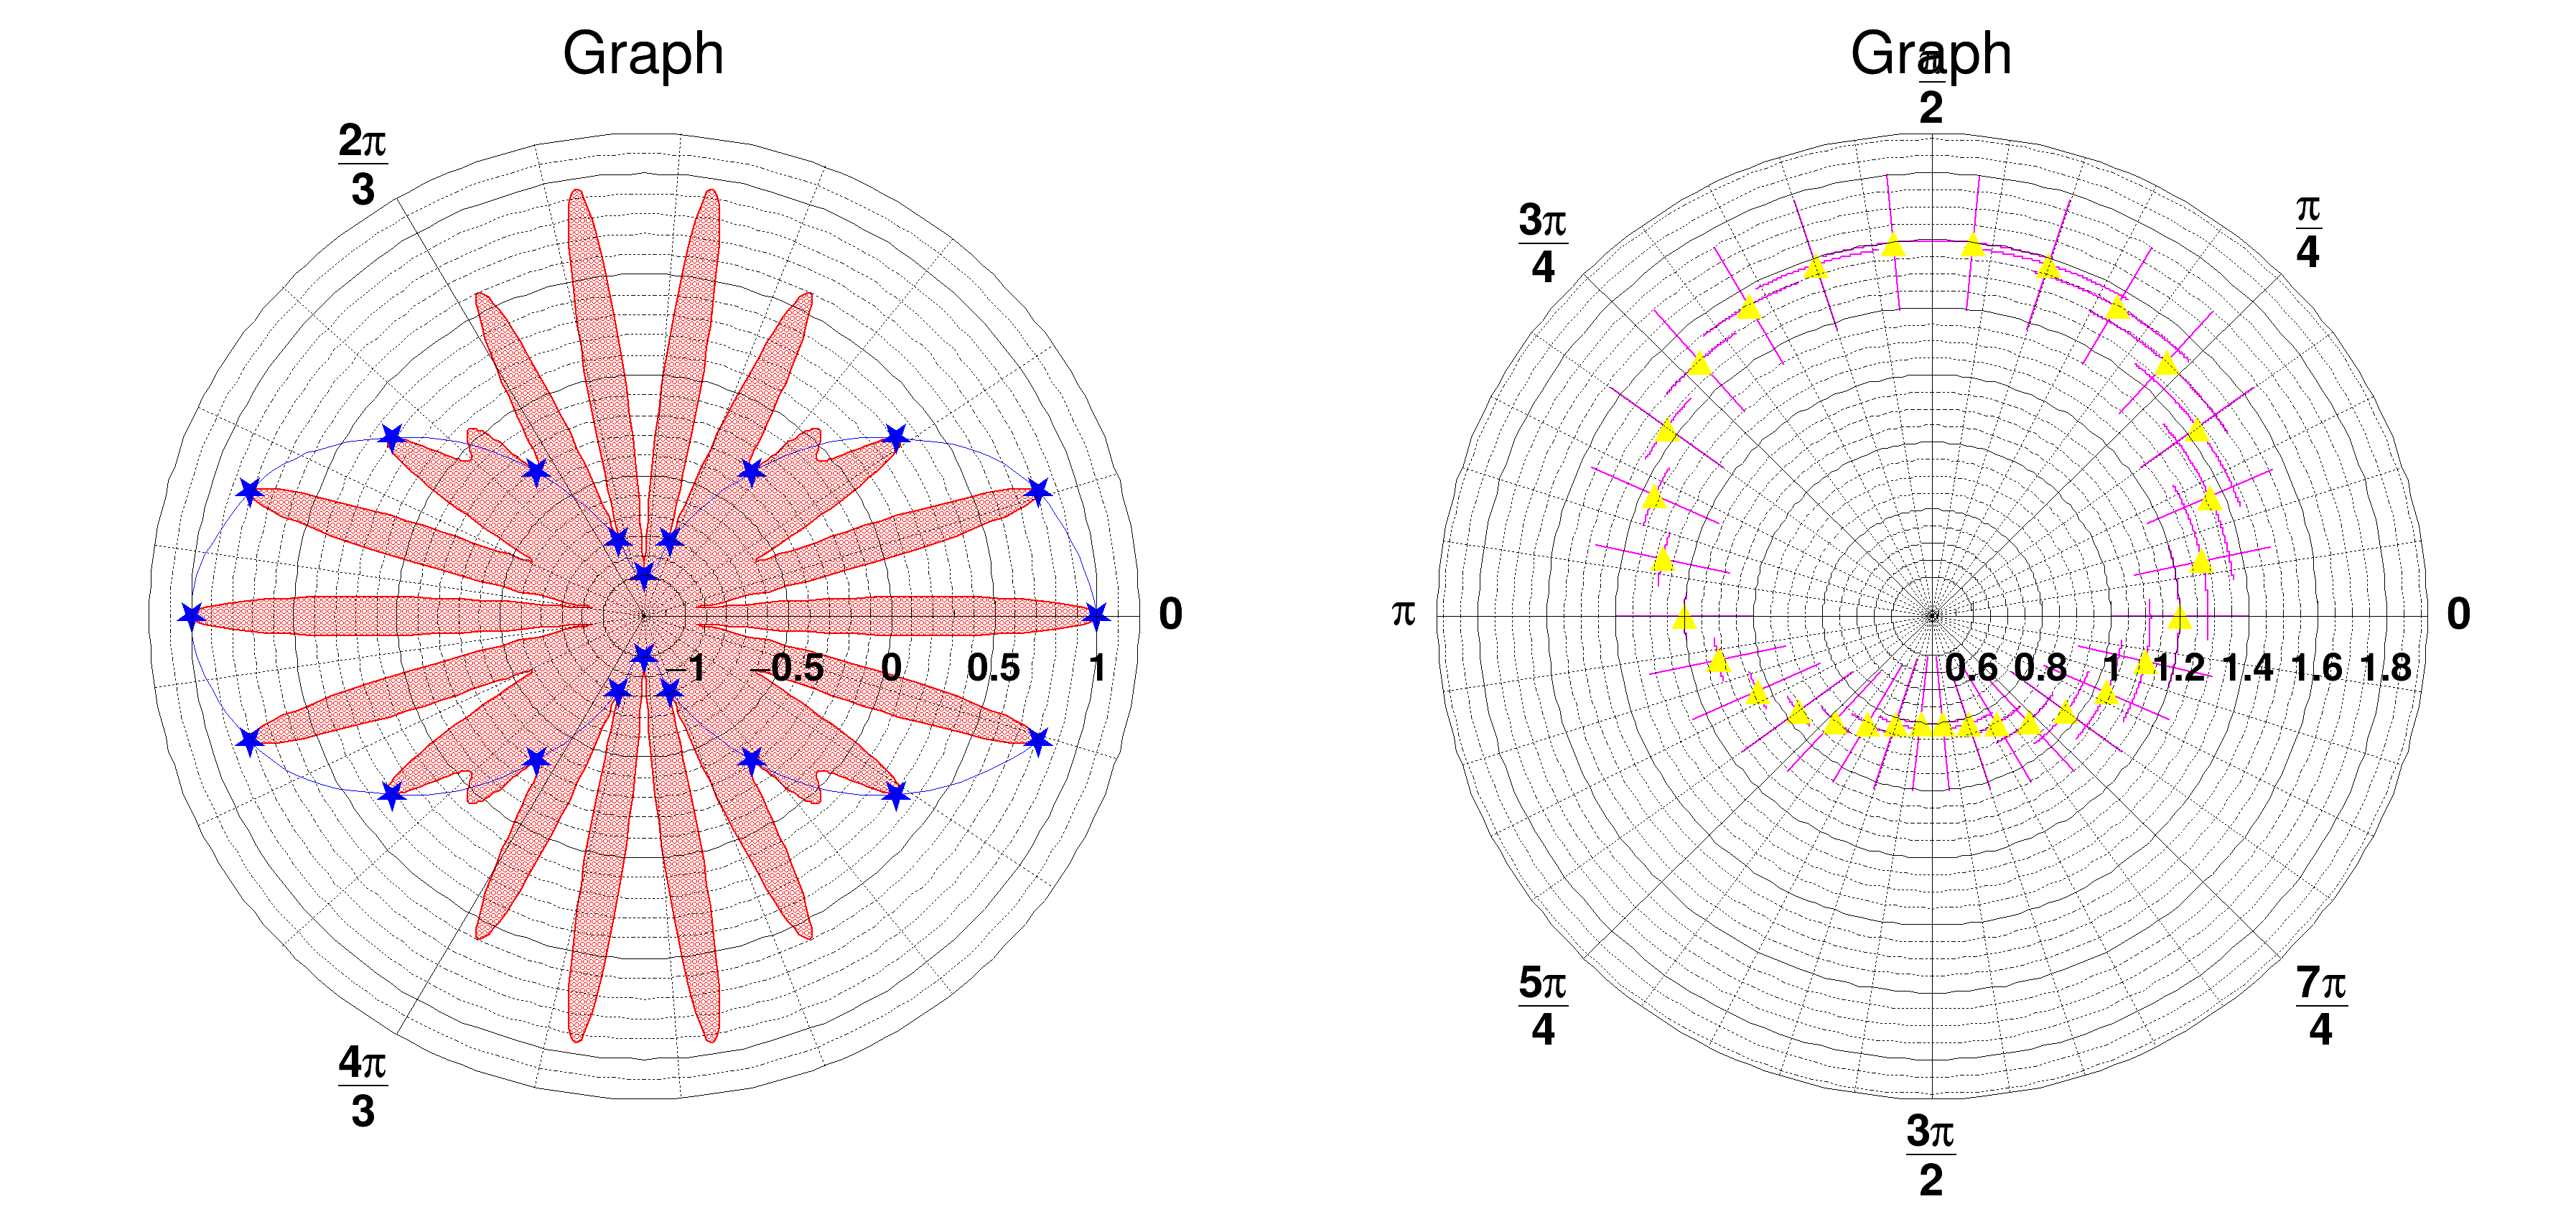
Create and draw a polar graph. 
See the TGraphPolar documentation
Since TGraphPolar is a TGraphErrors, it is painted with TGraphPainter options.
With GetPolargram we retrieve the polar axis to format it; see the TGraphPolargram documentation
  
 
import math
 
import numpy as np
import ROOT
 
CPol = 
ROOT.TCanvas(
"CPol", 
"TGraphPolar Examples", 1200, 600)
 
 
xmin = 0
 
 
fplot = 
ROOT.TF1(
"fplot", 
"cos(2*x)*cos(20*x)", xmin, xmax)
 
    x = 
np.append(x, ipt * (xmax - xmin) / 1000 + xmin)


ROOT::Detail::TRangeCast< T, true > TRangeDynCast
TRangeDynCast is an adapter class that allows the typed iteration through a TCollection.
 
Option_t Option_t SetTextSize
 
  - Author
 - Olivier Couet, Jamie Gooding 
 
Definition in file gr012_polar.py.