Allowing to overlay different graphs can be useful for comparing different datasets or for plotting multiple related graphs on the same canvas.
import numpy as np
import ROOT
n1 = 10
px1 =
np.array([-0.1, 0.05, 0.25, 0.35, 0.5, 0.61, 0.7, 0.85, 0.89, 0.95])
py1 =
np.array([-1, 2.9, 5.6, 7.4, 9, 9.6, 8.7, 6.3, 4.5, 1])
ex1 =
np.array([0.05, 0.1, 0.07, 0.07, 0.04, 0.05, 0.06, 0.07, 0.08, 0.05])
ey1 =
np.array([0.8, 0.7, 0.6, 0.5, 0.4, 0.4, 0.5, 0.6, 0.7, 0.8])
n2 = 10
x2 =
np.array([-0.28, 0.005, 0.19, 0.29, 0.45, 0.56, 0.65, 0.80, 0.90, 1.01])
y2 =
np.array([2.1, 3.86, 7, 9, 10, 10.55, 9.64, 7.26, 5.42, 2])
ex2 =
np.array([0.04, 0.12, 0.08, 0.06, 0.05, 0.04, 0.07, 0.06, 0.08, 0.04])
ey2 =
np.array([0.6, 0.8, 0.7, 0.4, 0.3, 0.3, 0.4, 0.5, 0.6, 0.7])
if stats1 and stats2:
ROOT::Detail::TRangeCast< T, true > TRangeDynCast
TRangeDynCast is an adapter class that allows the typed iteration through a TCollection.


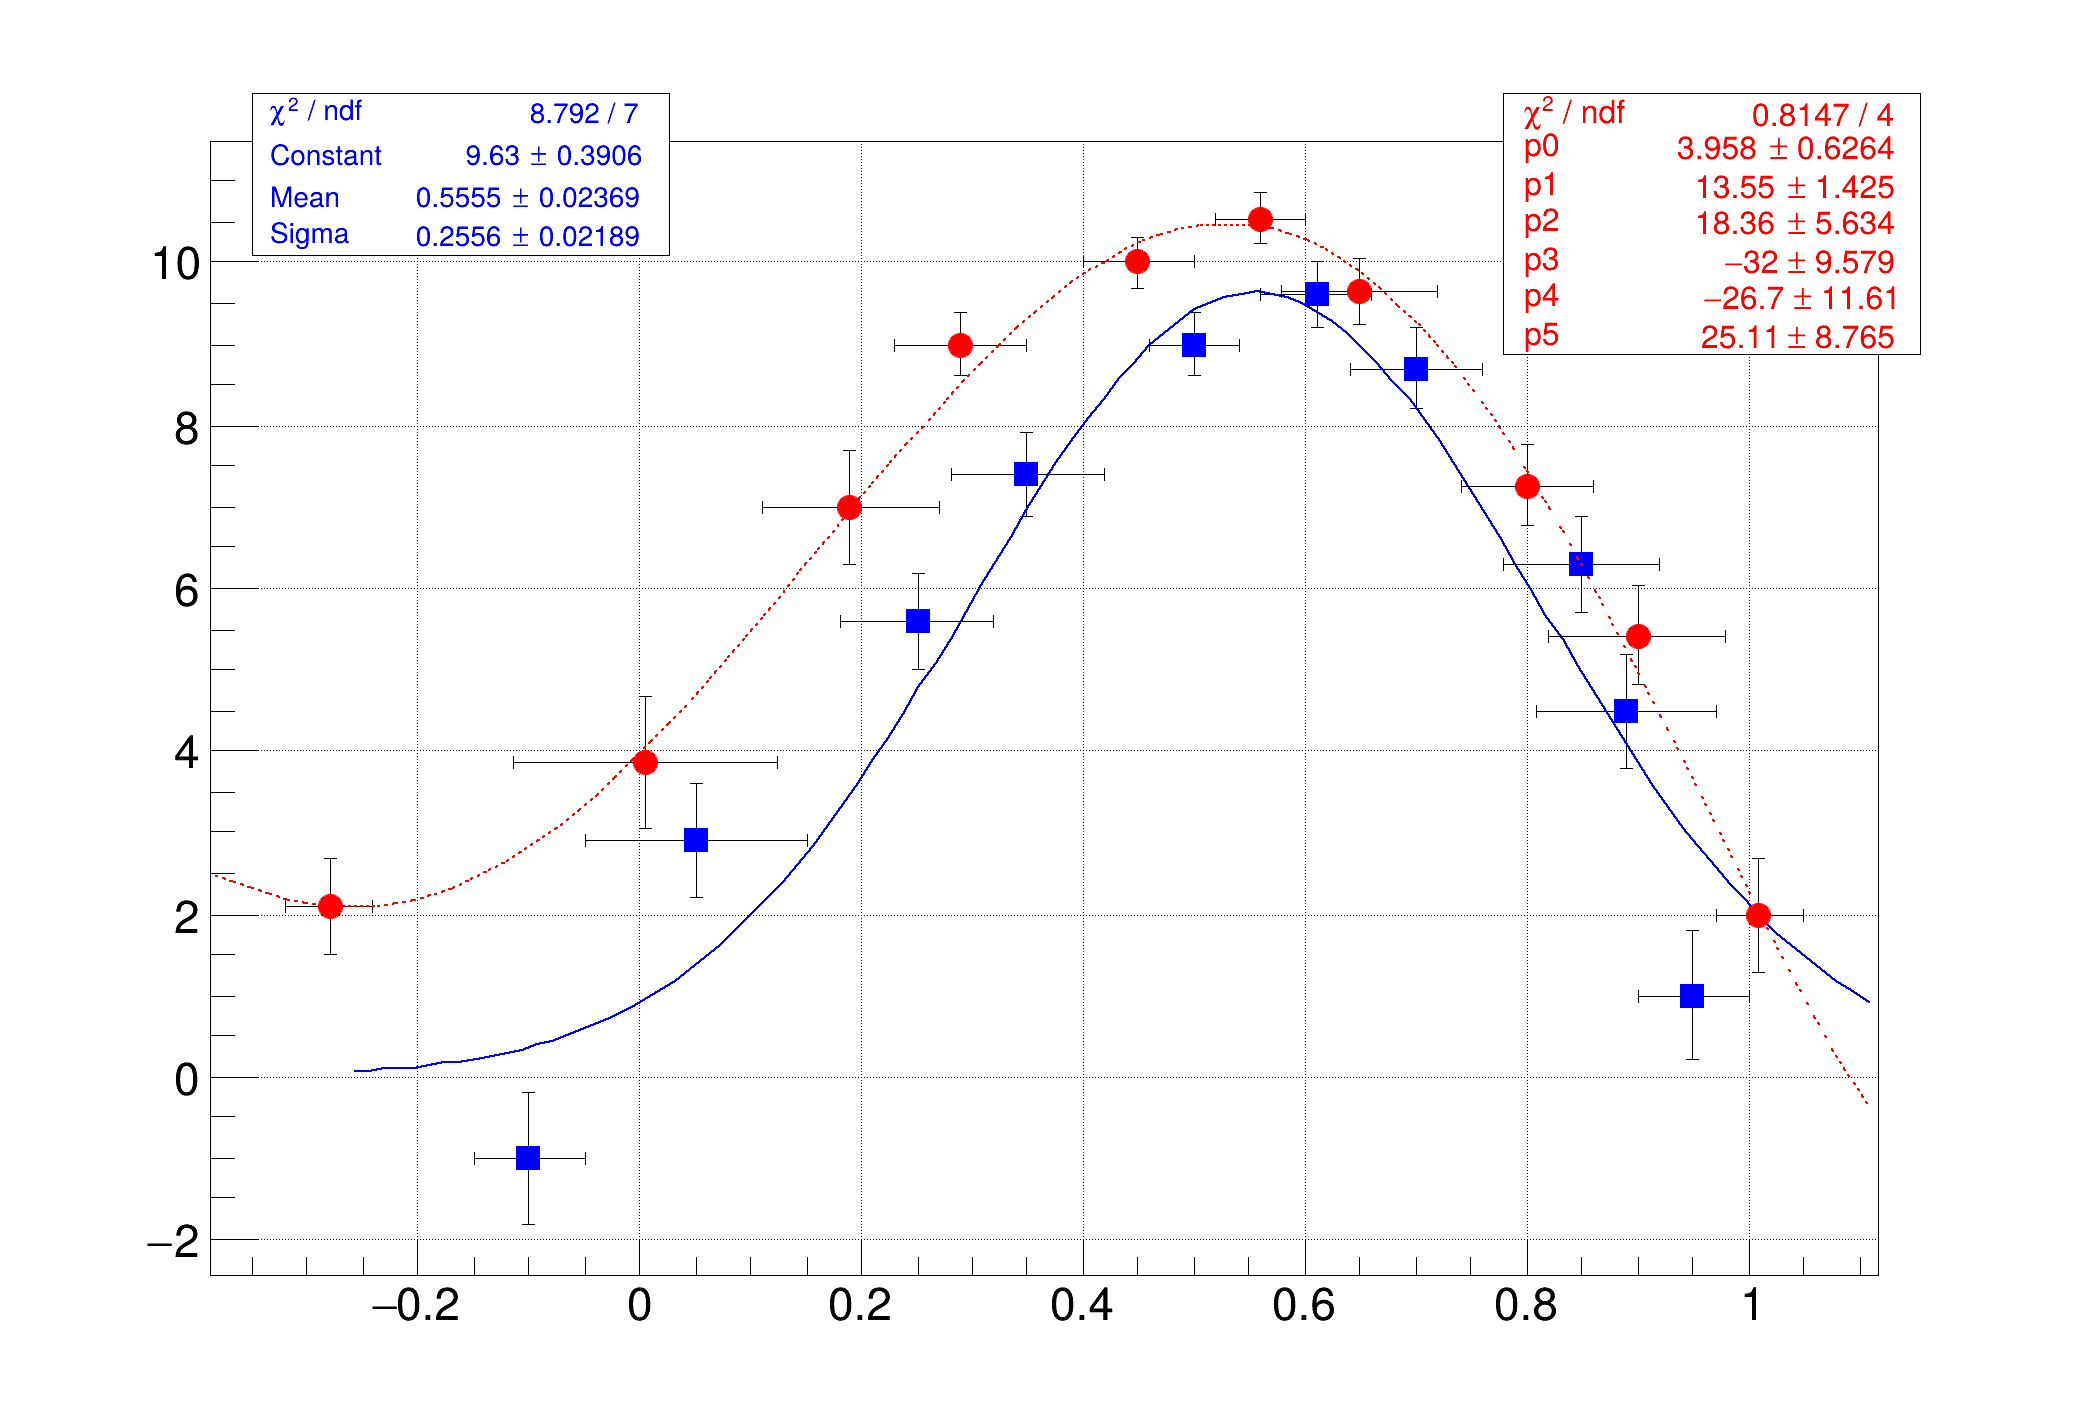 TMultiGraph is used to combine multiple graphs into one plot.